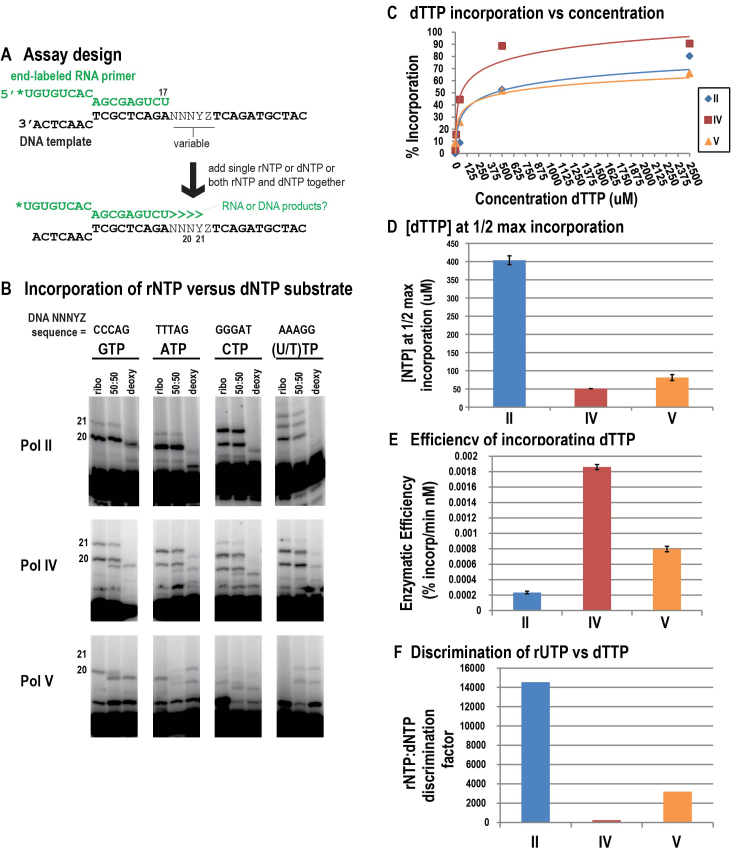
Figure 4.
Pols IV and V misincorporate dNTPs to a greater extent than Pol II. (A) Assay design. (B) Primer elongation assays in the presence of only rNTP, only dNTP, or a 50:50 rNTP:dNTP mix. (C) Percent incorporation (calculated by dividing the intensity of products resulting from incorporation of dTTP (21 nt) by the total intensity of products 20 nt and longer) is plotted versus nucleotide concentration, with linear regression used to fit the curves to the equation y = (Imax*x)/(Km*+x). (D) Pseudo Km's (Km*, nucleotide concentration at  maximum incorporation (Imax)) of Pols II, IV and V for dTTP. Note that Pols IV and V have higher affinity for dTTP than Pol II. (E) Efficiency at incorporating dTTP is calculated as Imax/Km*. Note that Pols IV and V are more efficient at incorporating dTTP than Pol II, with Pol IV being the most efficient. (F) rNTP:dNTP discrimination factor, calculated as UTP efficiency (see Figure 2)/dTTP efficiency. Pol II is over 60 times better than Pol IV and 4.5 times better than Pol V at discriminating between UTP and dTTP. Note that the increased incorporation of dNTPs by Pols IV and V relative to Pol II appears to result from their increased affinity for the dNTP.

