Figure 5.
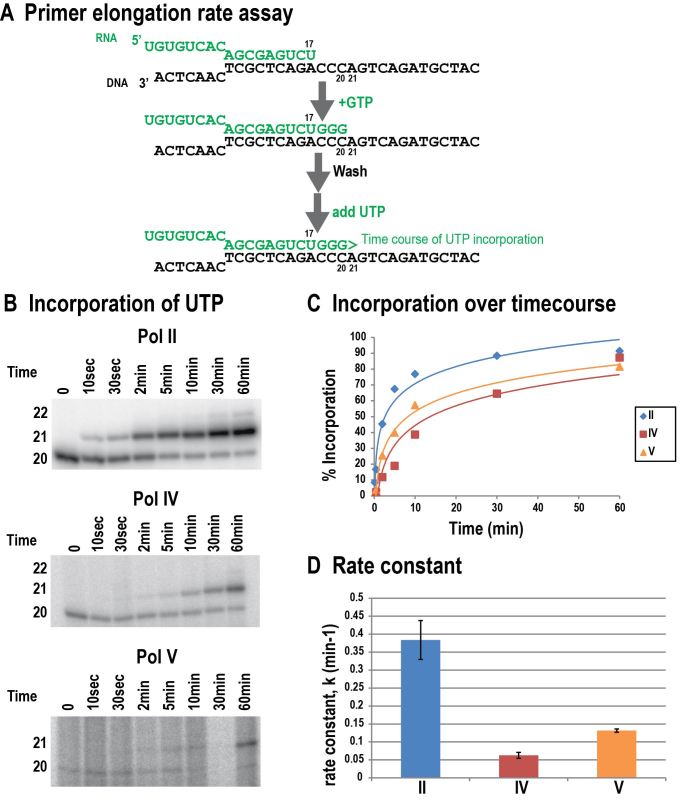
Relative nucleotide incorporation rates of Pols II, IV and V. (A) Assay design. (B) Representative gels showing the incorporation of UTP by Pols II, IV and V versus time (UTP concentration = 500 nM). (C) Percent incorporation (intensity of elongation products divided by total products) versus time, with linear regression used to fit the curves to the equation c(t) = A × (1 – exp[–k × t]). (D) Elongation rate constants for Pols II, IV and V. Data is representative of two replicate experiments (see Supplementary Figure S4).

