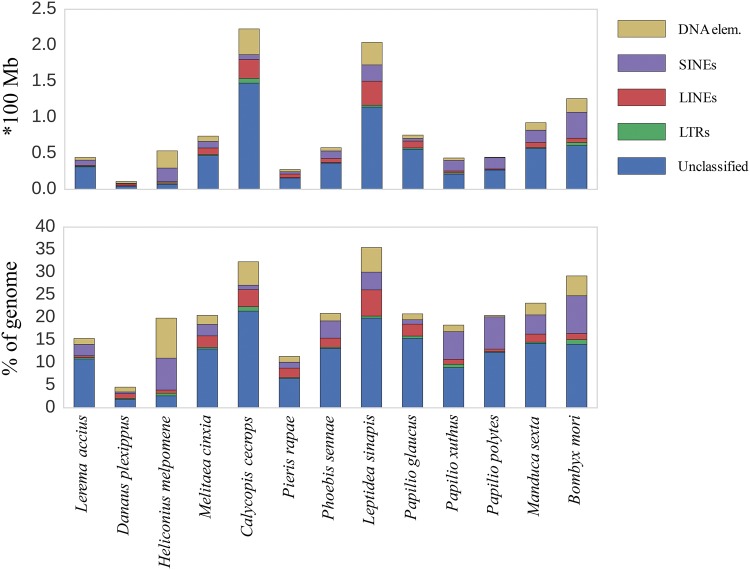
Fig. 3.
—Cumulative barplot illustrating the fractions of specific TE classes (color coded) and the total repeat content in L. sinapis and the 12 additional genome assemblies included in the comparative analysis. The top panel shows the total amount (in 100 Mb) and the bottom panel shows the genomic fractions (in %) of each specific TE class in each genome assembly.

