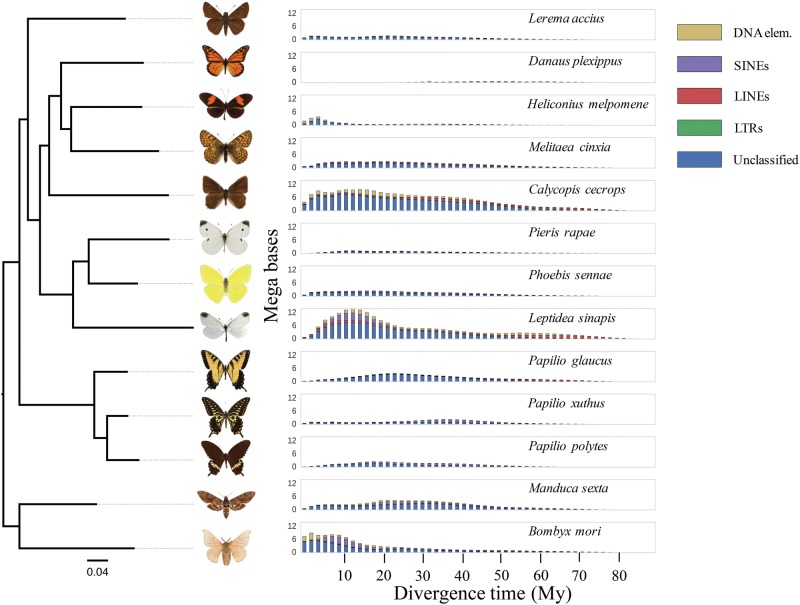
Fig. 6.
—Illustration of activity of different subclasses of TEs in the 13 lineages under study. The x-axis represents divergence time (Million years) estimated from copy to consensus differences in repeats (DNA elements, SINEs, LINEs, LTRs, and unknown) scaled by the neutral mutation rate, and the y-axis shows the total amount (Megabases) of repeats for each time interval. The phylogenetic tree shows the relationship between species as estimated using a set of 224 conserved nuclear genes.

