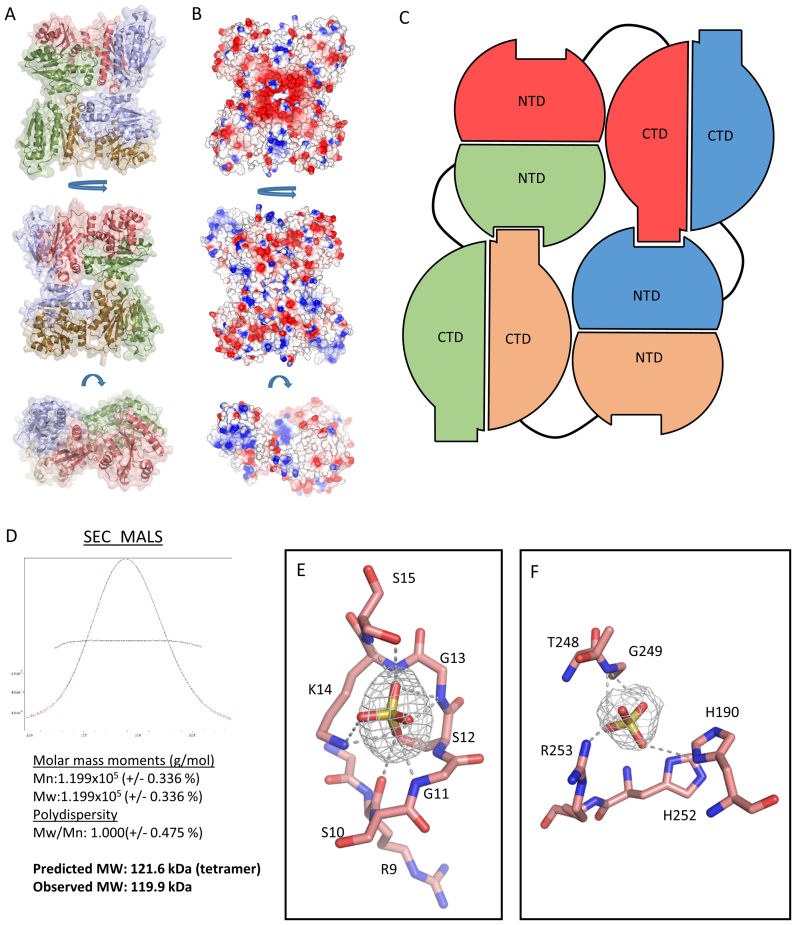
Figure 4.
The X-ray crystal structure of RapZ. (A) The X-ray crystal structure of RapZ in three orientations in cartoon representation with semi-transparent surface. The RapZ protomers are coloured red, blue, orange and green. (B) Electrostatic surface representation of the RapZ tetramer in three orientations as in A. Electropositive regions are coloured blue and electronegative regions are coloured red. (C) Diagram representation of the global domain architecture of RapZ. The protomers of RapZ are coloured red, blue, orange and green as in A. The protein assumes a tetrameric assembly in the crystal structure wherein some NTD-CTD contacts are satisfied whereas others are not. It is formally possible that in solution the tetramer is reorganized as a self-closing dimer of dimers that satisfies all the NTD-CTD contacts. (D) SEC-MALS analysis (top) reveals that RapZ elutes as a single peak in the chromatogram. Analysis of the peak fractions is summarized in the bottom panel. (E) A close up view of the putative Walker A-box in a single protomer of RapZ. Bound sulfate is shown as yellow and red sticks, with a Fo-Fc omit map for the ligand shown as grey mesh contoured at 3 σ. Residues forming the Walker-A box are shown. Hydrogen bonds are represented by grey dashed lines. (F) Sulfate modelled bound at the ‘malonate’ binding site in the RapZ-CTD (In the same orientation as Figure 3C). Bound sulfate is shown as yellow and red sticks, with a Fo-Fc omit map for the ligand shown as grey mesh contoured at 3 σ. Residues coordinating the ligand are shown as red sticks. Hydrogen bonds are represented by grey dashed lines.

