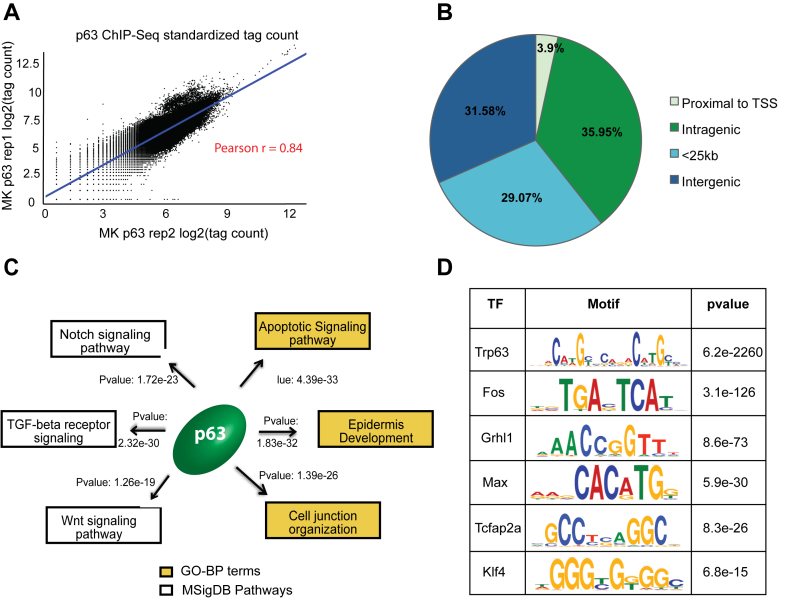
Figure 1.
Annotation and characterization of genomic target of p63 in mouse keratinocytes (MK) based on ChIP-Seq. (A) Scatterplot representing high degree of correlation between the MK1 and MK2 p63 ChIP-seq replicates based on total genomic tag density. The datasets were normalized to 20 million reads and the tag density was measured across the entire genome in 1 kb bins. (B) Distribution of p63 targets relative to RefSeq genes. The p63 binding sites are divided into 4 groups: Proximal to TSS (500bp +/− of TSS), intragenic (all introns and exons except first 500 bp), <25 kb (500 bp – 25 kb upstream of TSS or 25 kb downstream) or intergenic (the remaining genomic targets). (C) The top GO-BP terms and MSigDB pathways that are enriched for p63 targets based upon GREAT analysis. (D) TFs motifs enriched at mouse p63 target sites as determined using DREME and Tomtom implemented in MEME software suite.

