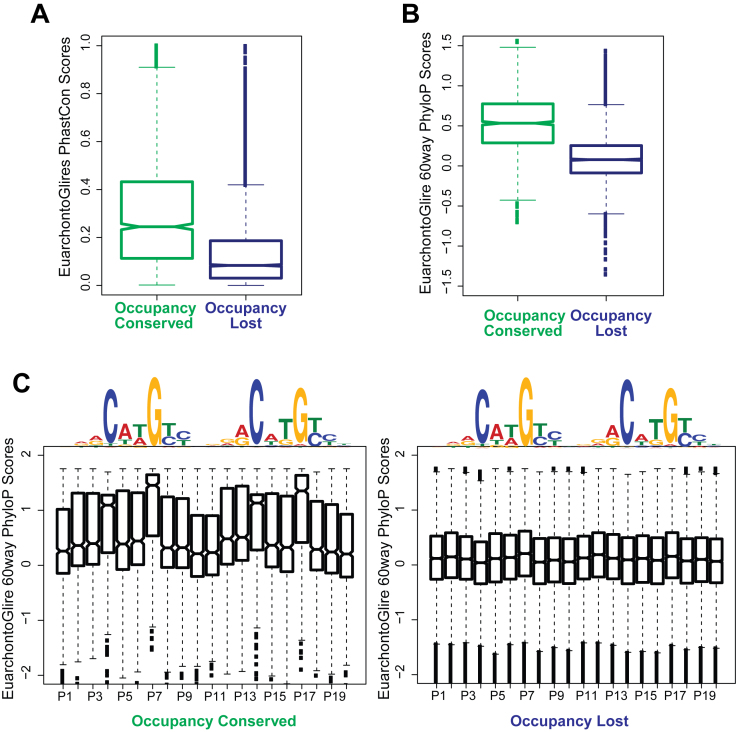
Figure 4.
Occupancy Conserved targets but not Occupancy Lost are under purifying selection across the EuarchontoGlires clade. (A) Conservation of the entire p63 ChIPed region: notched box plots represent average PhastCon scores for the EuarchontoGlires clade for mouse p63 targets (calculated across a 200 bp window centered at the p63 summit). The scores reflect the probability of the region being conserved. (B) Conservation of p63 motif: p63 targets belonging to both groups are filtered for only those genomic locations that have a p63 motif. For a 20 bp window centered at the p63 motif, average PhyloP scores (<0: positive selection; >0: negative selection) for the EuarchontoGlires clade is calculated at each genomic location. Notched boxplots are plotted of these PhyloP scores for both groups of p63 targets. (C) Notched box plots are plotted of PhyloP scores at p63 motif at per base pair resolution. Left panel: scores at all Occupancy Conserved genomic regions containing p63 motif. Right panel: scores at all Occupancy Lost genomic regions containing p63 motif.

