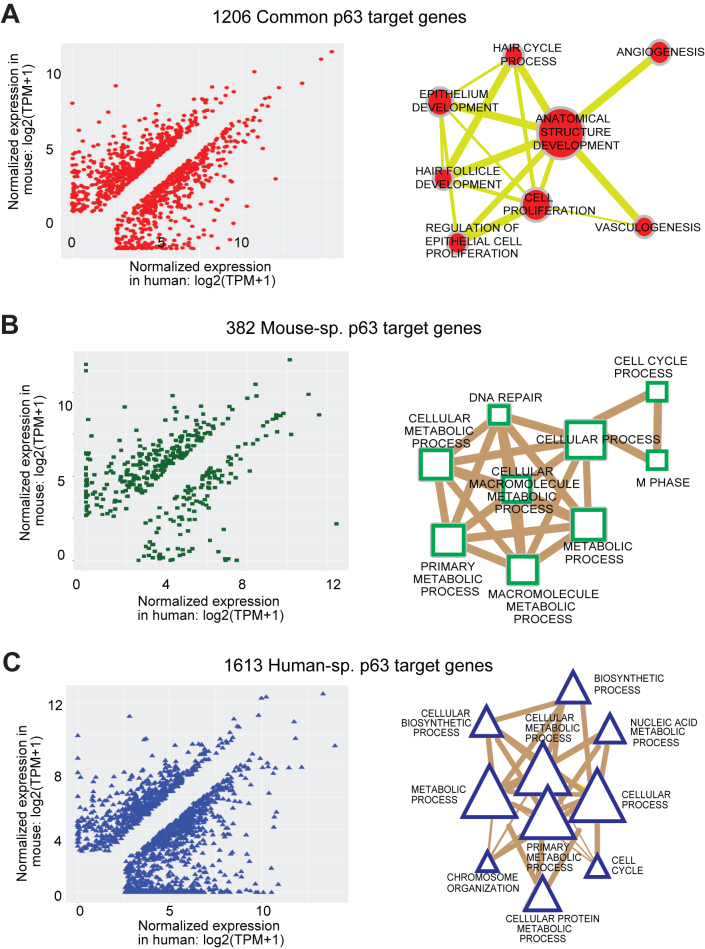
Figure 7.
Genes that are differentially regulated by species-specific p63 targeting. (A) A total of 3201 differentially expressed p63 target genes between mouse and human are divided into three groups. Left panel: scatter plot showing 1206 common genes that are targeted by p63 in both mouse and human. Right panel: network representing some of the most highly enriched GO-BP terms for the common differentially expressed genes (adjusted P-value cutoff: 1e-5). The size of the node represents the number of genes that are enriched for that biological process whereas the thickness of the lines connecting the nodes represents the number of genes that are common between the two processes. (B) Left panel: scatter plot showing 382 Mouse-sp. genes that are targeted by p63 exclusively in mouse. Right panel: network representing most highly enriched GO-BP terms for the Mouse-sp. differentially expressed genes (adjusted P-value cutoff: 1e-5). (C) Left panel: scatter plot showing 1613 Human-sp. genes that are targeted by p63 exclusively in human. Right panel: network representing most highly enriched GO-BP terms for the human sp. differentially expressed genes (adjusted P-value cutoff: 1e-5).

