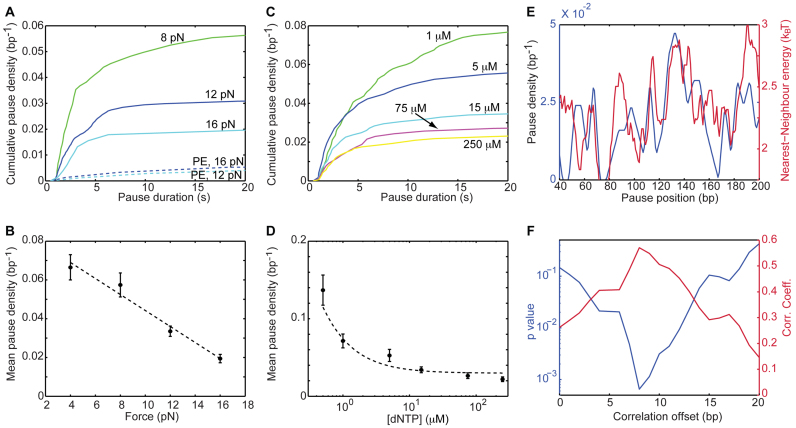
Figure 3.
RT senses the sequence ahead, and enters into the paused-state in a competition with elongation. (A and B) Dependence of the pause density on the applied force. The density of pauses during SD (but not PE) activity is sensitive to the force on the construct. (A) Cumulative pause densities. SD: Ntraces = 12,16,13. PE: Ntraces = 8,10. (B) The mean density of pauses, showing a linear dependence on the force (r = −0.98, P = 0.01, Pearson's correlation coefficient and P-value, respectively). Data shown as mean ± SEM. The dashed line shows the result of fitting the data to a linear equation (adjusted-r2 = 0.96) (C and D) Dependence of the short pause-density on [dNTP]. (C) Cumulative pause densities. Ntraces = 13,5,12,9,16. (D) The mean pause density, which stabilizes at saturating [dNTP] (r = −1, P = 0.003, Spearmans's correlation coefficient and P-value, respectively). Data shown as mean ± SEM. The dashed line was drawn to guide the eye. (E and F) The position-resolved pause density correlates with the local strength of the duplex, shifted by 8 bp. (E) Pause density, calculated on 5-bp windows (blue), and strength of the base pair being polymerized, as calculated from the nearest neighbor model and averaged over a 10-bp running window (green). (F) Pearson's correlation coefficient (green) and P-value (blue) for the correlation between pause density and energy, as a function of the offset between them.

