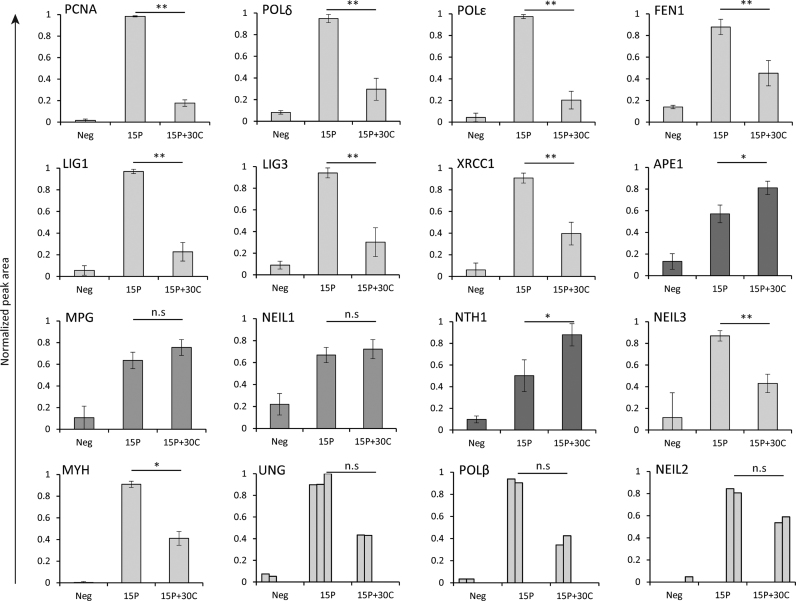
Figure 4.
Replication and BER/SSBR proteins detected by iPOND-PRM. Bars represent normalized peptide peak areas of replisome enriched (light gray), chromatin enriched (dark gray) and proteins with no enrichment (mid gray). Mean ± SD are shown for PCNA, POLδ, POLϵ, FEN1, LIG1, LIG3, XRCC1, APE1, MPG, NEIL1, NTH1 (all n = 5), NEIL3 (n = 4) and MYH (n = 3). For UNG2, POLβ and NEIL2, each biological replicate is illustrated. Statistical significance was calculated using a two-sided paired Student's t-test, where *: P < 0.05, **: P < 0.01, n.s: not significant. The FA concentration used for iPOND was 0.25%.

