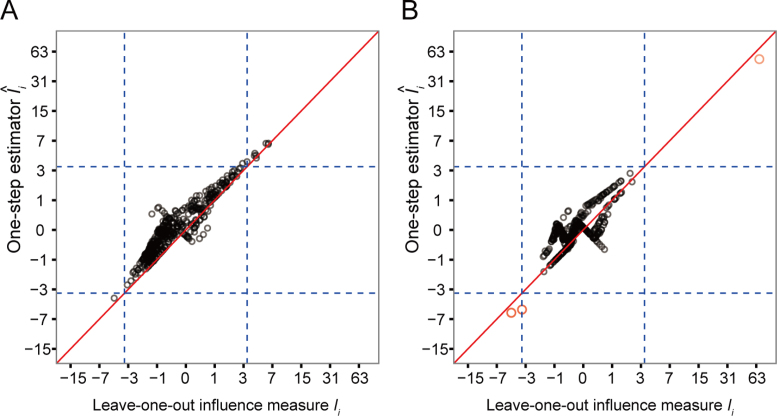
Figure 6.
Accuracy of the computationally efficient one-step estimator  . The computationally efficient one-step estimator
  is compared with the leave-one-out influence measure Ii under scenarios when (A) there are no outliers and when (B) outliers are present. There are n = 250 samples each for cases and controls. Counts were generated from NB(μi, ϕi) for controls and NB(2log2FCμi, ϕi) for cases with log2FC = 2, where μi = exp (5 + (xi1 + xi2)/2) and ϕi = exp (4 + (xi1 + xi2)/2). Additional covariates xi1 and xi2 were simulated from binomial distributions Binom(2, prob = (0.5, 0.5)). In (B), five samples were randomly replaced by outliers simulated from Pois(exp (5)exp (4)). Non-outlying samples (in black) and outliers (in magenta) are plotted. Reference lines (in dashed blue) are drawn at the (αout/2)th- and (1 − αout/2)th-quantile of the variance-gamma distribution with αout = 0.05. A diagonal reference line (in solid red) is drawn at equality of
  and Ii. In (B), all five outliers were identified by the one-step estimator
  .
.

