Figure 1.
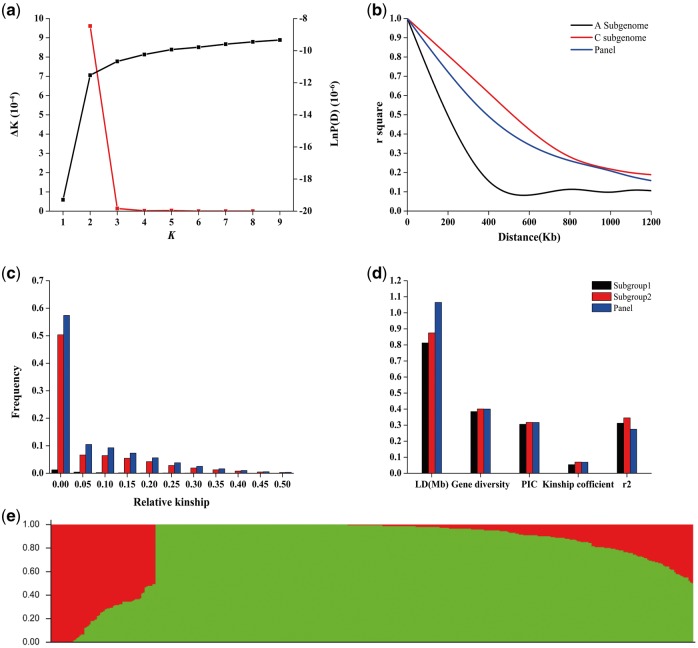
(a) The rate of change in log probability (LnP(D)) and adhoc statistic ΔK (delta K) of population structure in the 405 B. napus population association panel. (b) Linkage disequilibrium (LD) of the B. napus panel and A, C subgenomes. (c) The relative kinship of the B. napus panel and two subgroups. (d) LD, gene diversity, polymorphism information content (PIC) and kinship coefficient of the B. napus panel and two subgroups. (e) Two subgroups of the B. napus panel when K equals 2.

