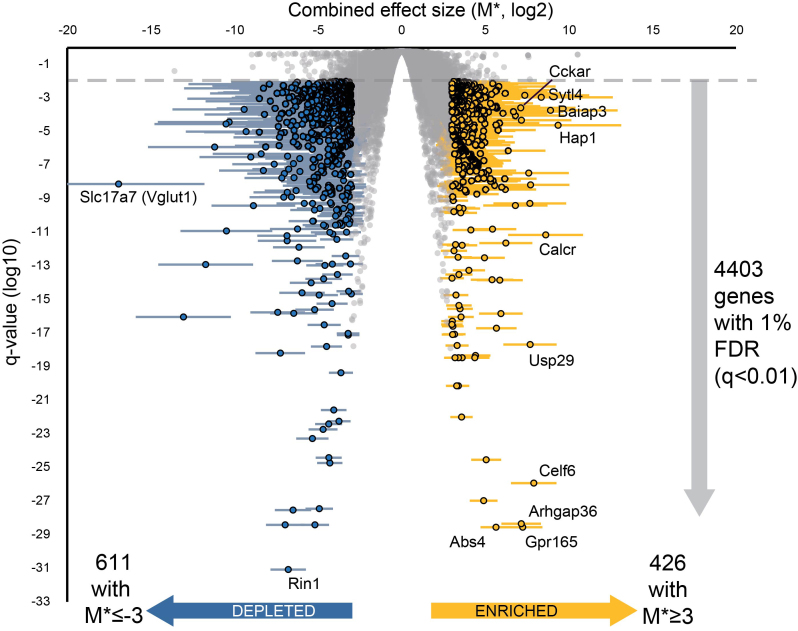
Figure 2.
Volcano plot of genes found to be enriched in the SCN by meta-analysis. Plot shows enrichment in SCN versus WB (combined effect size, M*, derived from log2-transformed fold changes) against the significance (FDR-corrected q-value), with error bars showing 95% confidence intervals. Genes with q < 0.01 and M* ≥3 shown in gold (426 highly enriched) and those with q < 0.01 and M* ≤−3 shown in blue (611 highly depleted). Genes labelled are the top enriched genes by combined effect size, or by significance, as well as the most depleted and most significant depleted genes.

