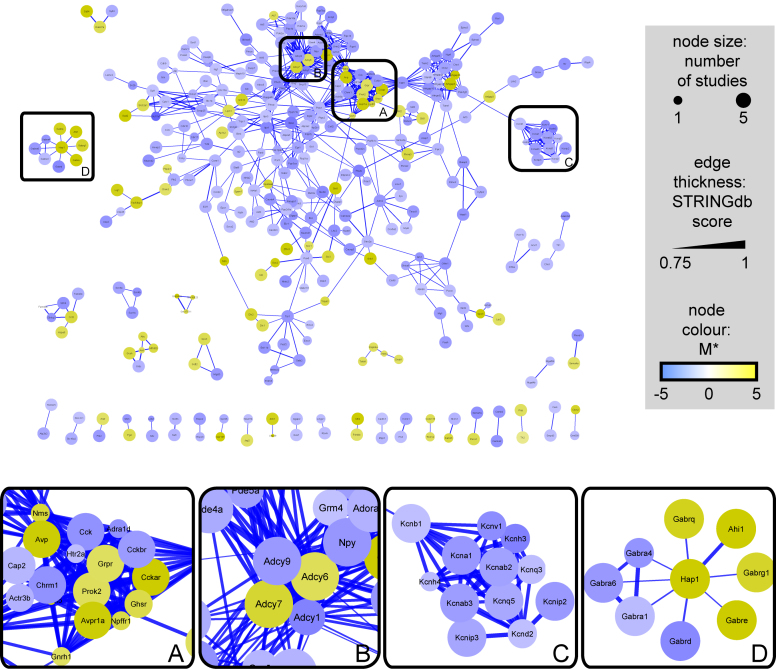
Figure 4.
Network graph of SCN-enriched and SCN-depleted transcripts, constructed using interactions from the STRING database. Cut-off for interactions was an overall STRING score ≥0.75 and only those gene symbols with one or more interactions are displayed (339 of 1037). Side Panels (A–D) are enlargements of clusters within the network. Nodes are shown in gold for enriched transcripts and blue for depleted ones, with edge-thickness mapped to the overall score of the interaction from the STRING database (thickest lines = highest confidence).

