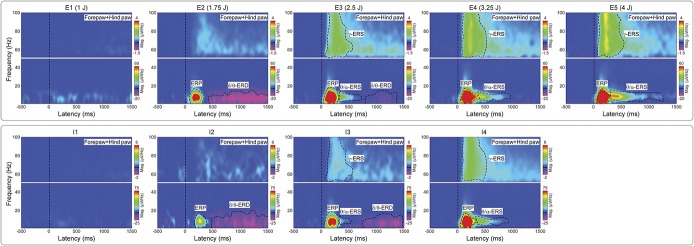
Figure 4.
Time–frequency distributions of single-trial EEG responses at different stimulus energies (E1-E5) and different levels of pain-related behaviors (I1-I4). Group-level TFDs of single-trial rat-LEP responses measured from the 4 central electrodes (FL2, FR2, PL1, and PR1) for each stimulus energy (E1-E5, top panel) and each level of pain-related behavior (I1-I4, bottom panel). Responses from the 4 stimulation sites were pooled. The color scale represents the increase or decrease of oscillation magnitude, relative to a prestimulus interval (−400 to −100 ms). Time–frequency features are marked with dashed black lines. Note how the magnitudes of ERP, θ/α-ERS, and γ-ERS increase with both stimulus energy and pain-related behavior. By contrast, the magnitude of δ/θ-ERD is maximal at stimulus E2 and pain-related behavior I2. Pain-related behavior l1: 0≤NRS<1; pain-related behavior l2: 1≤NRS<2; pain-related behavior l3: 2≤NRS<3; pain-related behavior l4: 3≤NRS≤4; ERS, event-related synchronization; ERD, event-related desynchronization; ERP, event-related potential; LEP, laser-evoked potential; NRS, numerical rating scale (0-4); TFD, time–frequency distribution.

