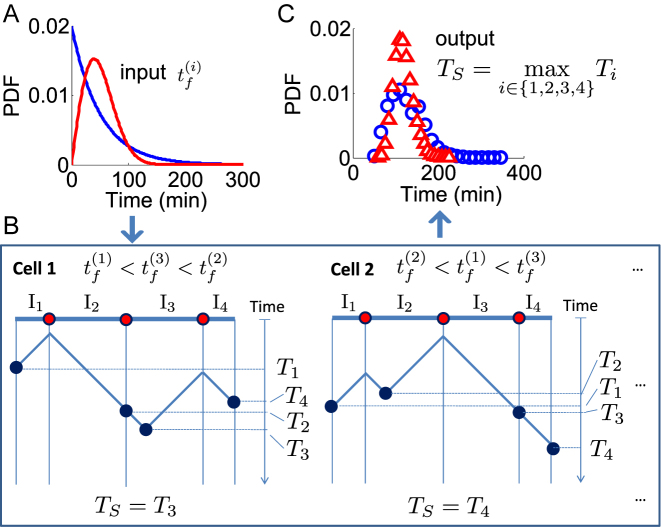
Figure 1.
The S-phase duration is the maximum between the stochastic termination time of all inter-origin regions. The illustration considers replication of one linear chromosome with three origins. (A) The activation of each origin is stochastic, and the firing time  follows a given phenomenological distribution. (B) In each cell, each origin randomly chooses a firing time from this distribution. The last replicated inter-origin region, which may be different in different cells, determines the total duration of the S phase. In the sketch, red circles indicate origins. Dark blue circles indicate the latest replicated loci for each inter-origin region. Some origins (e.g. the one between I2 and I3 in cell 1) may be replicated passively, and never fire in some realization. (C) The stochastic model generates a distribution of S-phase durations, which expresses the cell-to-cell variability. The parameters used in the plots are: chromosome length L = 300 kb, fork velocity
  = 1 kb/min, firing exponent γ = 0 (blue line in (A) and blue circles in (C)) or 1 (red line in (A) and red triangles in (C)), origin locations x1 = 50 kb, x2 = 150 kb and x3 = 250 kb, origin strength λ1, 2, 3 = 0.02 min −1 (for γ = 0) or 6.3 × 10⁻⁴ min −2 (for γ = 1).

