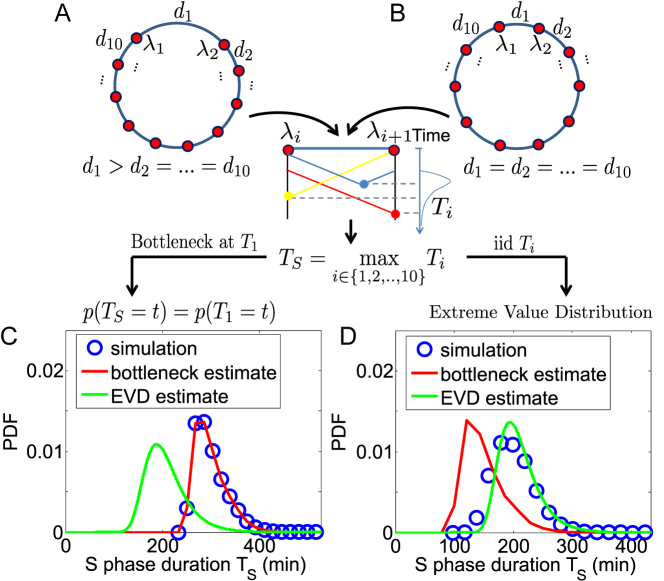
Figure 2.
Analytical estimates indicate the existence of two replication regimes. (A) If a single ‘bottleneck’ inter-origin region (labelled by the index 1 in panels A and B) is typically the last to complete replication, TS will be typically equal to T1 (inter-origin distances in the example are di = 167 kb for all origins except d1 = 500 kb). (B) If the replication times of all inter-origin regions are comparable, and they are considered independent and identically-distributed (iid) random variables, the distribution of TS can be obtained by extreme-value-distribution (EVD) theory (inter-origin distances are di = 200 kb). Simulations of the model (blue circles), when one inter-origin distance is much larger than the others (C), and when all inter-origin distances and strengths are comparable (D), agree with the corresponding analytical calculations (red and green curves). (Origin number n = 10 origins, fork velocity  = 1 kb/min, origin strength λi = 0.02 min −1.)

