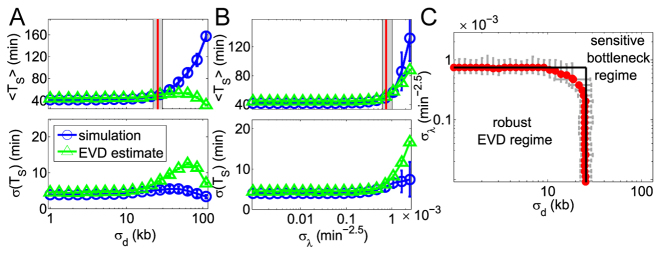
Figure 4.
The variabilities of the inter-origin distances, σd, and of the firing strengths, σλ, set the replication regime. (A, B) Average S phase duration (top panels) and its standard deviation (bottom panel) as functions of σd (panel A) or σλ (panel B), obtained by simulations of the model (blue circles and lines) and by the EVD estimate (green triangles and lines). Fifty samples of inter-origin distances and origin strengths are chosen according to the distributions in Eq. (2). Red lines indicate the transition points where the simulated 〈〈TS〉〉 is 20% larger than at σd = 0 and σλ = 0. The border lines of the grey area show the transition points for 〈〈TS〉〉 + σ (〈TS〉) and 〈〈TS〉〉 − σ (〈TS〉) respectively. (C) Phase diagram separating the EVD and bottleneck regimes. Red transition points with error bars (obtained with the method shown in (A) and (B)) form an approximate rectangle phase boundary. Parameters: fork velocity  = 1.81 kb/min, origin number n = 20, γ = 1.5, 〈d〉 =28.13 kb, 〈λ〉 =6.17 × 10⁻⁴ min −2.5, σλ = 0 (A) and σd = 0 (B).

