Figure 5.
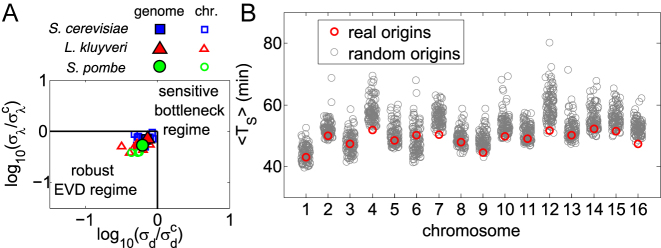
The replication program of yeast is in the robust regime. (A) Symbols are the parameters of S. cerevisiae (blue squares), L. kluyveri (red triangles) and S. pombe (green circles), inferred from fits with replication timing data from (6,7,22) respectively (see Supplementary Table S1). Filled symbols correspond to the whole genome, hollow symbols to each chromosome. (B) For each chromosome of S. cerevisiae, the average S-phase duration (y axis) is compared (by simulations of the model) between empirical origin positions and firing strengths (red circles) and randomized origins with empirically fixed distributions (grey circles).

