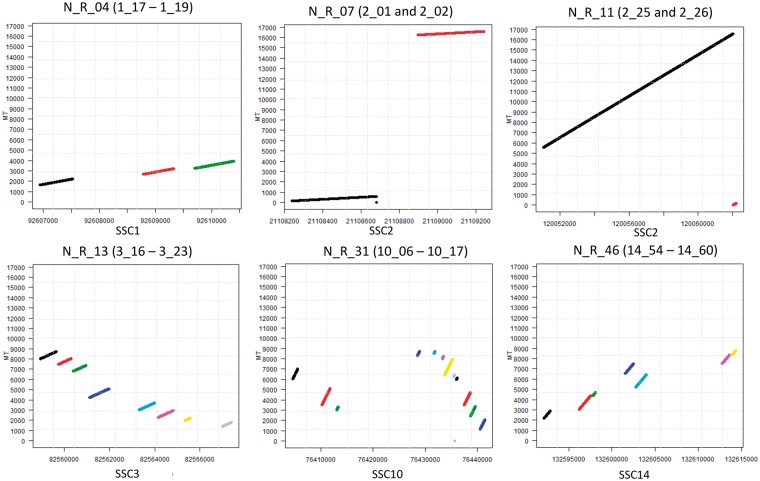
Figure 2.
Dot-plot analysis of a few numt regions. Numt region ID and numt sequences are reported at the top of each plot. The X axis reports the positions in the indicated chromosomes. The Y axis reports the mtDNA sequence coordinates. Details of these regions are reported in Supplementary Table S3. Different coloured lines in the plots indicate different numt sequences.

