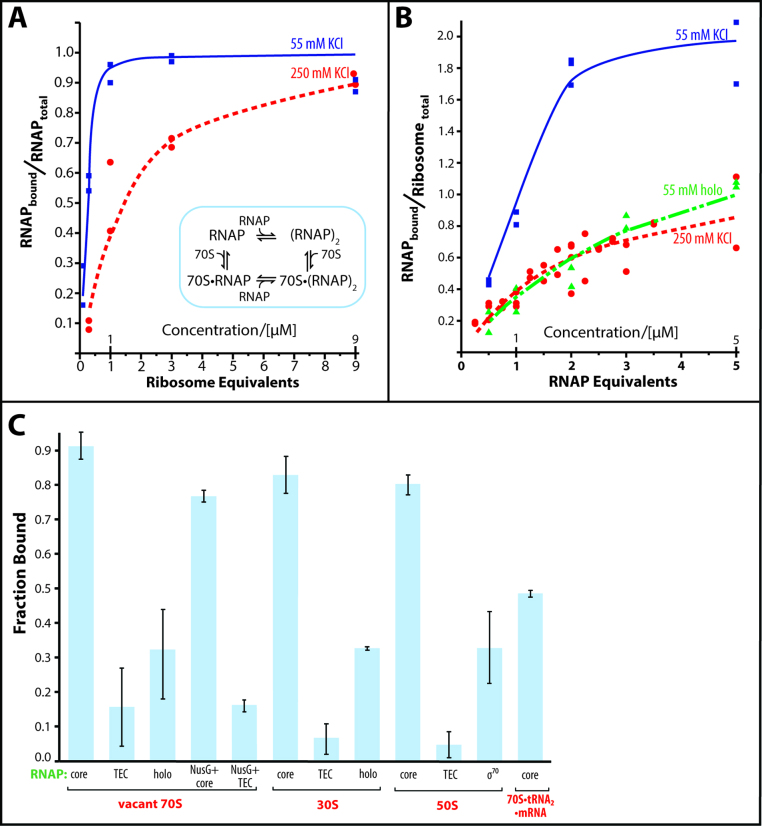
Figure 2.
Titration of RNA polymerase with ribosomes and vice versa. (A) Binding of ribosomes to RNA polymerase. RNA polymerase (1 μM) is incubated with increasing concentrations of ribosomes in the presence of 55 mM KCl (blue squares) or 250 mM KCl (red circles). The inset displays the proposed binding model of complex formation. (B) Binding of RNA polymerase to ribosomes. Ribosomes (1 μM) are incubated with increasing concentrations of RNA polymerase core enzyme (blue squares) or holoenzyme (green triangles) in the presence of 55 mM KCl or 250 mM KCl (red circles, core enzyme only). The lines connecting the data in A and B are the binding curves calculated as described in the Materials and Methods section of the text. For the holoenzyme, the simulated binding curve in the presence of dimer–monomer equilibrium is shown. (C) Influence of the functional state of the RNA polymerase and of the ribosome on the RNA polymerase•ribosome complex formation. The complex formation of ribosomes (70S), small subunits (30S), large subunits (50S) and tRNA-bound ribosomes (70S•tRNA2•mRNA) with RNA polymerase core enzyme (core), transcription elongation complex (TEC), holoenzyme (holo), core enzyme and transcription elongation complex in the presence of NusG (NusG + core and NusG + TEC) was analyzed by sucrose gradient centrifugation.

