
Fig. 5.
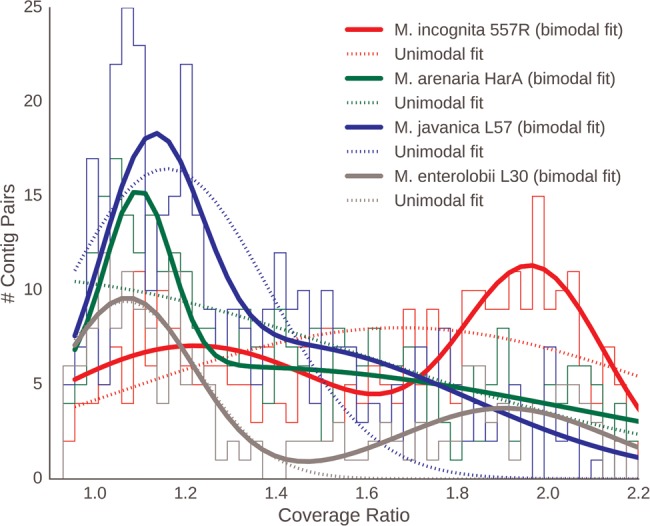
—Coverage data suggest hypotriploidy in MIG genomes. Histograms of relative coverages of alpha and beta genome contigs in several MIG genomes and Meloidogyne enterolobii. The solid lines represent binomial Gaussian and the dotted lines unimodal Gaussian models of the data.