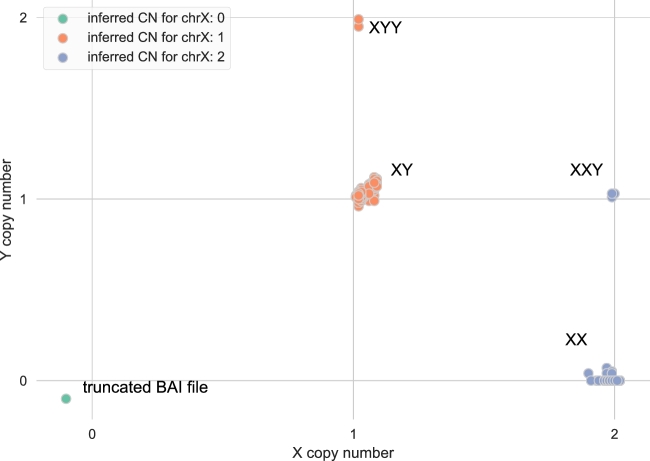
Figure 3:
Sex inference plot for a cohort of 2076 human WGS samples analyzed with indexcov. Samples projected on this plot represent ∼30–40× human WGS from 519 “quartet” families recently analyzed as a study of simplex autism [13]. The x-axis shows the copy number for chrX, and the y-axis shows the copy number for chrY inferred by indexcov. Sex is inferred from the copy number of X. As expected, we see 2 dominant clusters of samples, 1 of males (X = 1 and Y = 1) and 1 of females (X = 2 and Y = 0). Notably, indexcov further identifies samples with supernumerary sex chromosome aneuploidies (XXY and XYY), which had previously been identified by SNP microarray analysis [15]. The green point in the lower left just below the origin represents a sample with no apparent coverage on chromosomes X or Y due to a truncated BAM index file, which can be rapidly corrected once identified by indexcov QC.

