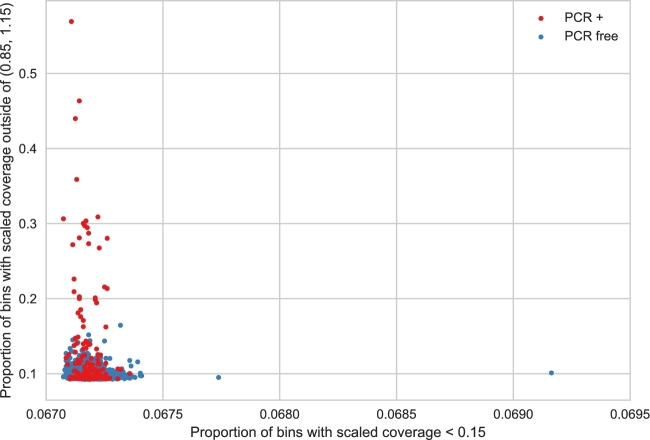
Figure 4:
Proportion of 16 384-bp bins where the estimated coverage is less than 0.15 on the x-axis and outside of (0.85–1.15) on the y-axis among 2076 human WGS samples. High values on the x-axis indicate large areas with low or no coverage. Values on the y-axis indicate samples with a large bias—with high variance in coverage values. Note that the samples that were PCR-amplified (red) as part of the sample-preparation are generally more likely to have a higher proportion of bins outside of the expected (0.85–1.15) range.

