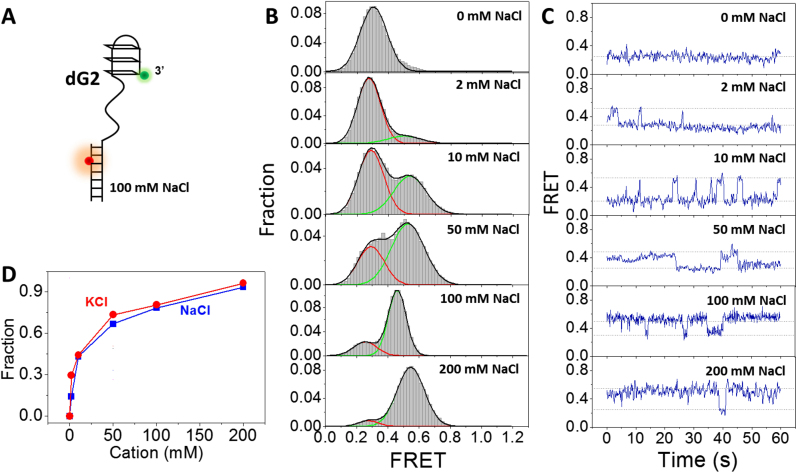
Figure 4.
Formation of G-hairpin at the 3′ end of ss/dsDNA. (A) Design of dG2 substrate. (B) FRET distributions of dG2 in 0–200 mM NaCl. Single-peak and two-peak Gaussian distributions were used to fit those histograms. (C) Selected FRET traces of dG2 in 0–200 mM NaCl. (D) Fractions of G-hairpin in different concentrations of NaCl and KCl.

