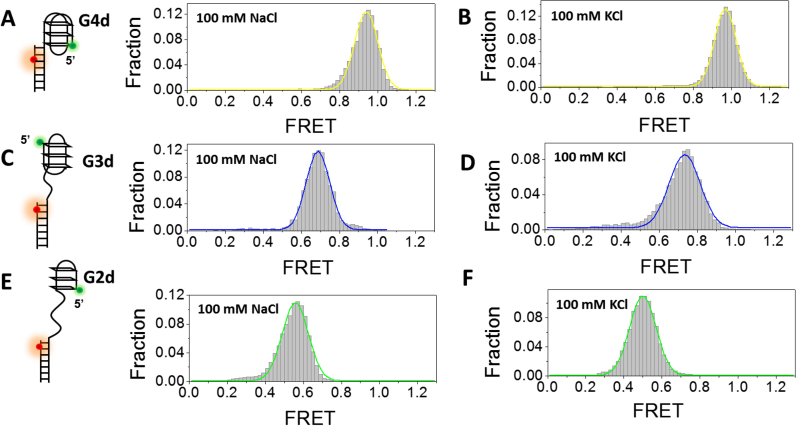
Figure 6.
Formation of G4, G-triplex and G-hairpin at the 5′ end of a duplex DNA in 100 mM NaCl or KCl. (A) smFRET histograms of G4d in 100 mM NaCl has 1 peak at E0.94. (B) smFRET histograms of G4d structures in 100 mM KCl has 1 peak at E0.96. (C) smFRET histograms of G3d structures in 100 mM NaCl has 1 peak at E0.69. (D) smFRET histograms of G3d structures in 100 mM KCl has 1 peak at E0.73. (E) smFRET histograms of G2d structures in 100 mM NaCl has 1 peak at E0.56. (F) smFRET histograms of G-hairpin structures in 100 mM KCl has 1 peak at E0.50.

