Figure 5.
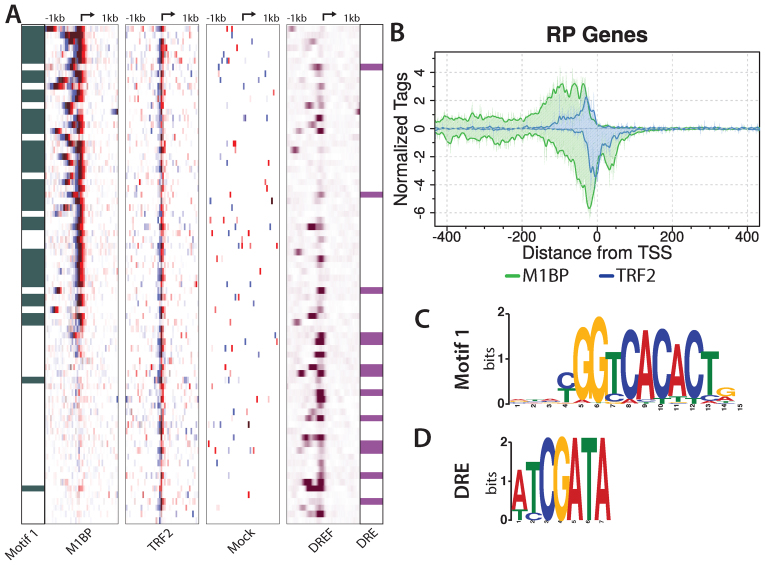
M1BP and TRF2 co-occupy the majority of RP gene promoters. (A) M1BP, TRF2 and Mock ChIP-exo reads and DNA replication-related element-binding factor (DREF) ChIP-seq reads mapped relative to the TSS of 78 RP genes and sorted by M1BP ChIP-exo reads summed in a 2 kb window centered on the TSS. RP genes having Motif 1 or a DRE within 200 bp of the TSS are indicated in green in the far left panel or purple in the far right panel, respectively. The arrow at the top of each heatmap marks the TSS. Eight paralogs lacking a TCT motif or TRF2 peak have been removed. (B) ChIP-exo analysis of M1BP (green trace) and TRF2 (blue trace) for RP genes. Composite plots in single nucleotide bins were generated from the same RP gene list used for the heatmap in panel A. (C and D) Logo representation of the Motif 1 or DRE position weight matrices (PWM) used to identify genomic motif locations.

