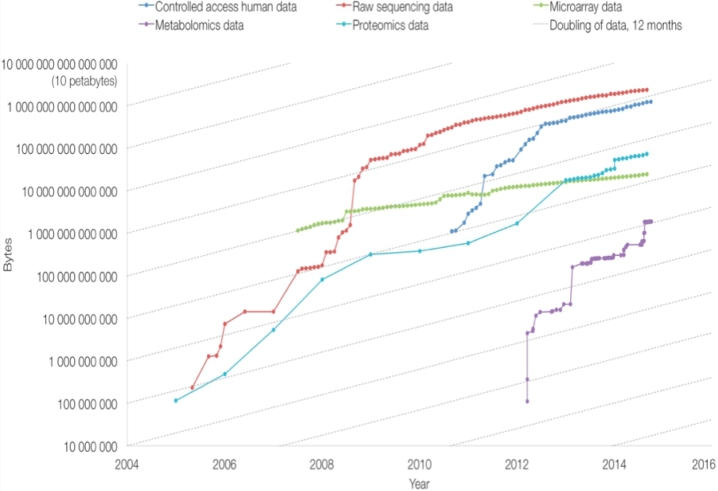
Figure 1:
Growth in data repositories at the EMBL-EBI. The graph shows the data volume in each of the repositories over time on a logarithmic scale. Shown are repositories for controlled access human data, raw sequencing data, microarray, proteomics, and metabolomics data. Archives were started at different moments in history. Metabolomics shows the steepest growth of all repositories at the EMBL-EBI.

