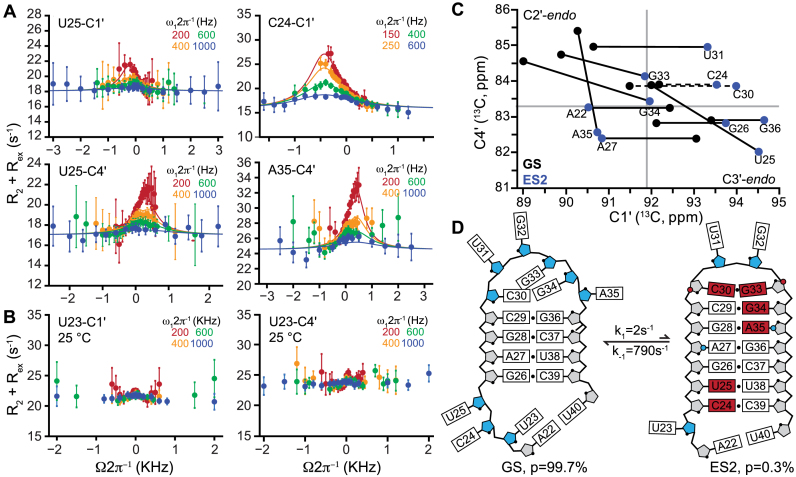
Figure 4.
Millisecond timescale sugar repuckering tied to ES2 formation. Representative C1΄ and C4΄ off-resonance R1ρ RD profiles collected on a 600 MHz (1H frequency) spectrometer and 35°C for nucleotides involved in ES2 exchange. The sample conditions were 1.0–1.4 mM HIV-1 TAR in 15 mM sodium phosphate 25 mM NaCl, 0.1 mM EDTA, pH 6.4 and 100% D2O. Error bars represent experimental uncertainty determined by propagation of error determined based on a Monte Carlo analysis of monoexponential decay curves and the signal to noise. Solid lines represent global fits of the C1΄ and C4΄ RD data (see main text, Supplementary Table S5). Shown are RD profiles for nucleotides that (A) experience non-helical to helical transitions and (B) profiles observed for U23 which maintains a C2΄-endo conformation in both GS and ES2. (C) Plot of C1΄ and C4΄ chemical shifts of ES2 deduced from R1ρ measurements showing transitions toward the helical C3΄-endo sugar pucker. Solid gray lines indicate C2΄-endo/C3΄-endo boundaries (see Supplementary Table S2 for exact values) Dashed lines indicate nucleotides for which the magnitude of C4΄ chemical shift could not be measured due to overlap. (D) Secondary structure of the TAR upper stem in GS and ES2. Nucleotides with C2΄-endo (blue) and C3΄-endo (gray) in ES2 as deduced using the RD-derived sugar chemical shifts are highlighted. Nucleotides that undergo changes in secondary structure are in red. The blue circles on A27-C1΄ and A35-C1΄ indicate a decrease in χ-angle relative to A-form helix. Red circles on C30-C4΄, and G33-C4΄ indicate an increase in the γ dihedral angle relative to A-form helix.

