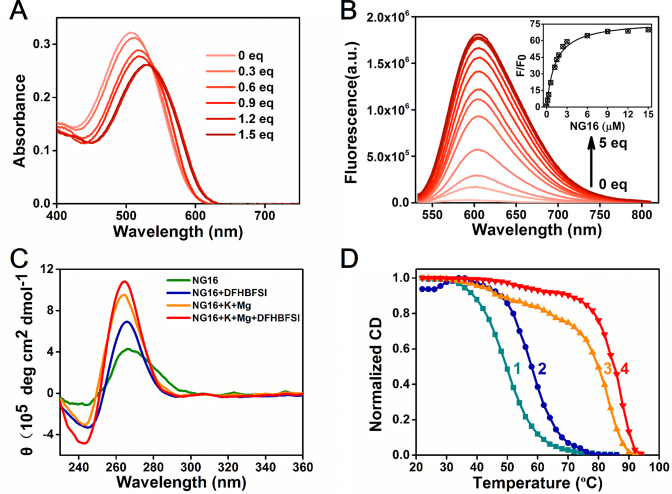
Figure 3.
(A) Absorption and (B) emission spectra of DFHBFSI (10 and 3 μM) upon stepwise addition of NG16. Inset of B is plot of fluorescence enhancement ratio (F/F0) versus the concentration of NG16. (C) Changes in CD spectra of NG16 (10 μM) upon the addition of DFHBFSI (50 μM) in different buffer conditions. K+, 100 mM; Mg2+, 50 mM. (D) CD melting curves of NG16 (5 μM) at 265 nm under different conditions. NG16 (curve 1) and NG16 with DFHBFSI (25 μM, curve 2) in buffer without metal ions; NG16 (curve 3) and NG16 with DFHBFSI (25 μM, curve 4) in buffer containing K+ (100 mM) and Mg2+ (50 mM).

