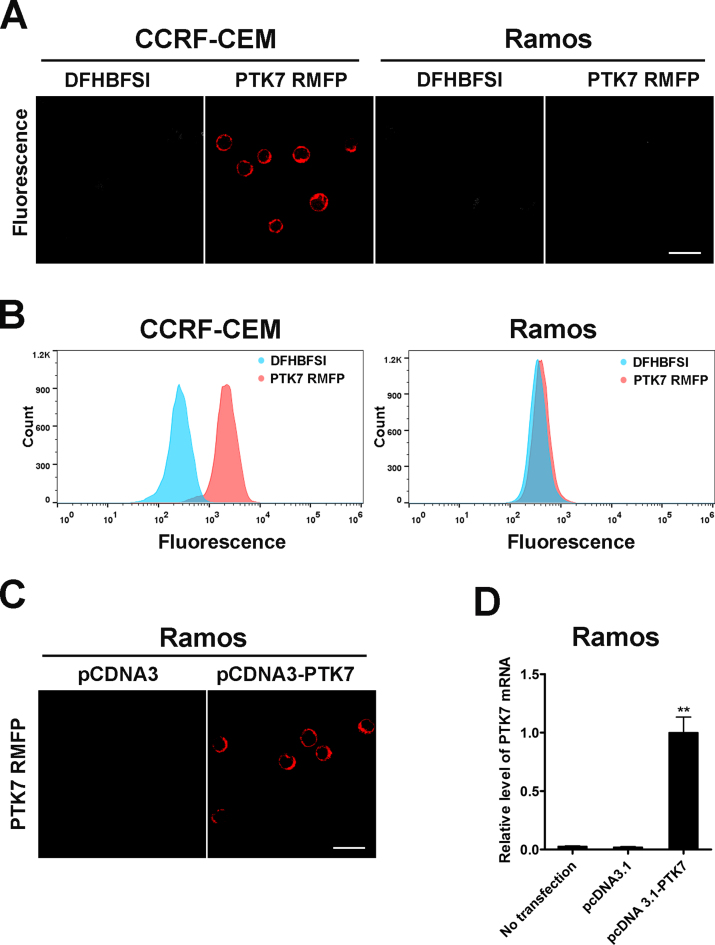
Figure 7.
(A) Confocal microscope image of PTK RMFP treated CCRF-CEM cells and Ramos cells at 570–620 nm emission channel using 488 nm excitation, Scale bar: 20 μm. (B) Flow cytometry of PTK RMFP treated CCRF-CEM cells and Ramos cells. (C) Confocal microscope image of PTK RMFP treated Ramos cells with transfection of pcDNA3-PTK7 at 570–620 nm channel, Scale bar: 20 μm. (D) Relative mRNA level of PTK7 in Ramos cells with transfection of pcDNA3-PTK7 using real-time quantitative reverse transcription PCR. Values are means with SD (n = 3), **P < 0.001.

