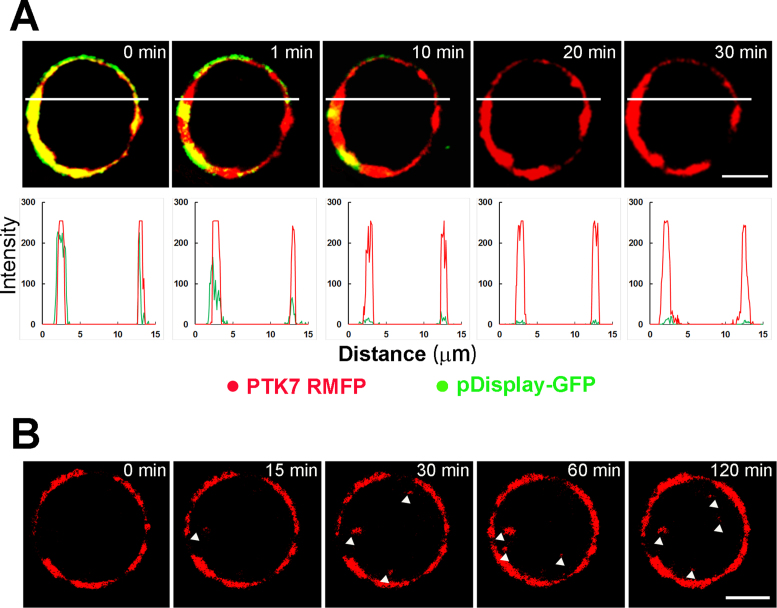
Figure 8.
(A) Time-lapse confocal microscope images of PTK RMFP treated CCRF-CEM cells with transfection of pDispaly-GFP for different time spans. The images were acquired using 488 nm excitation and presented as overlay images (top) from 500 to 550 nm emission channel (green) and 570–620 nm emission channel (red), respectively, Scale bar: 5 μm. Co-localization analysis of red and green fluorescence channels of upper images (bottom). (B) Long duration confocal microscope image at different time span of PTK RMFP treated CCRF-CEM cells at 570–620 nm emission channel using 488 nm excitation, Scale bar: 5 μm.

