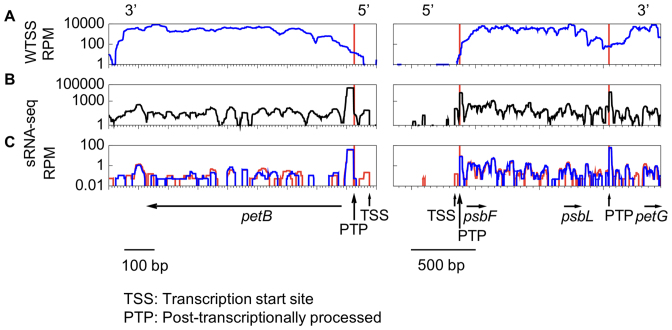
Figure 1.
Transcriptional profile over petB and the psbF-psbL-petG polycistronic unit. Coverage (log scale) of (A) pooled bi-directional and directional WTSS; (B) pooled sRNA-Seq; (C) mock- (blue) versus RPP-treated (red) WT sRNA-Seq libraries. Red vertical lines indicate the position of the mature 5′ ends. Vertical arrows point to cosRNAs marking a TSS or PTP. In A and C, coverage is normalized as RPM.

