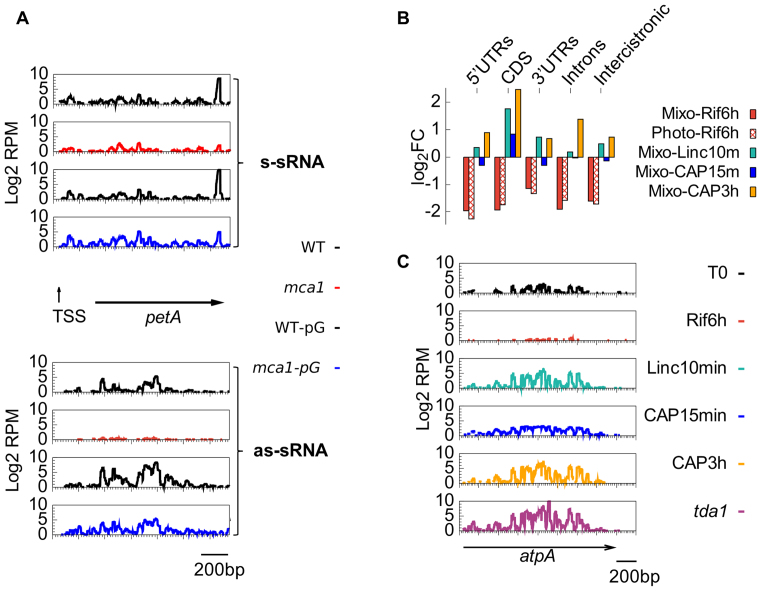
Figure 10.
The effects of transcription and translation inhibition on the production of as-sRNAs. (A) Coverage of sense (upper panels) and antisense (lower panels) sRNA over the petA gene in (top to bottom) WT, mca1, WT-pG and mca1-pG). (B) log2FC of the averaged RPMs of drug-treated samples over the control per Cp region. (C) Coverage of antisense sRNAs along the atpA gene, following Rif, Linc or CAP treatment and in mutant tda1.

