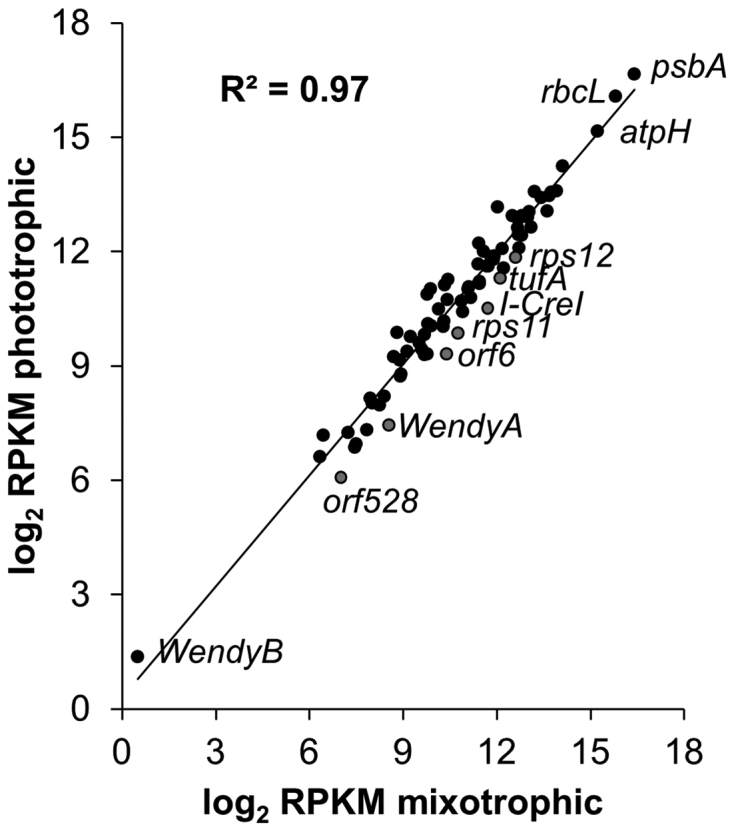
Figure 5.

Gene expression in mixotrophic and phototrophic conditions (log2 transformed RPKM values). RPKM values were computed on CDS, on the three exons of psaA and on the WendyB and tscA genes. The value for psbA is the average of the RPKM computed independently for the five exons. Differentially expressed genes are in grey.
