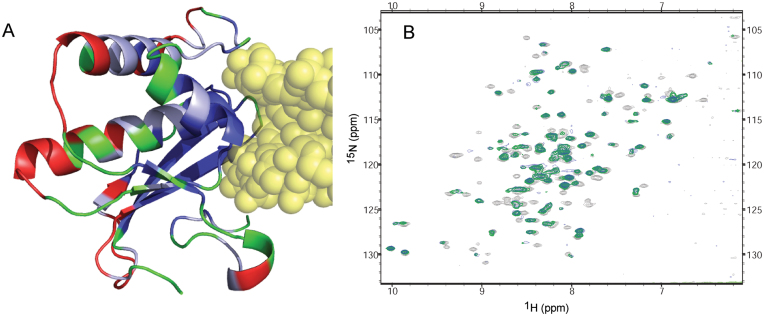
Figure 7.
NMR studies of BhRNase H:RNA–DNA complex. (A) Crystal structure of BhRNase H in complex with amide-modified RNA–DNA (yellow), with protein residues colored according to chemical shift perturbation properties upon addition of RNA–DNA. Blue: residues whose NMR peaks disappear or are clearly shifted at least two line-widths due to added RNA–DNA. Light blue: peaks that shifted one to two line-widths. Red: peaks that shifted less than one line-width. Green: peaks where the shift is ambiguous (usually due to spectral crowding), or that were unassigned. (B) 15N-HSQC spectra of free BhRNase H (light grey), BhRNase H bound to unmodified RNA–DNA (green), and BhRNase H bound to amide-modified RNA–DNA (blue).

