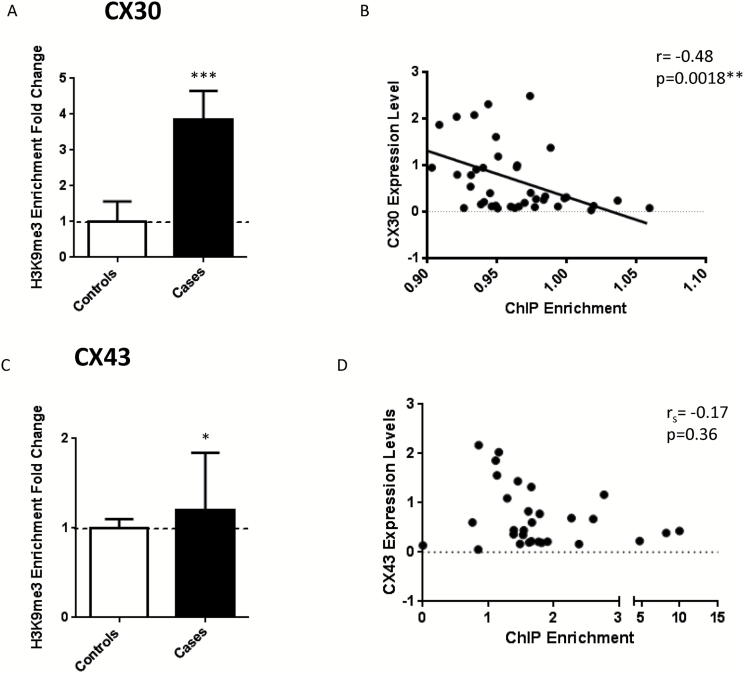
Figure 3.
Enrichment of the repressive chromatin mark H3K9me3 is increased in cases compared to controls. (a) Enrichment of H3K9me3 in CX30 is increased in cases (t(40)=4.036, P=.0002) and inversely correlate with gene expression (b) Pearson correlation (r(40)=-0.48, P=.0018). (c) CX43 also shows an increase in H3K9me3 enrichment (U(35)=93, P=.048) though the fold change was not as strong and d) the correlation though inverse, was not significant (Spearman Rho(30)=-0.17, P=.36).

