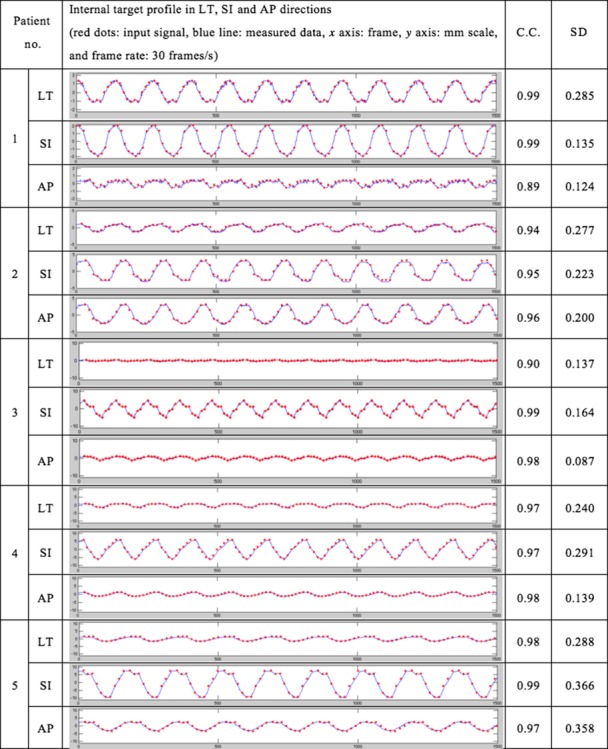
Fig. 7.

Motion tracking analysis in the G-arm system. Internal target profile in LT, SI and AP directions. The red dots are input signals and the blue line represents measured data. The x-axis is the frame, and the y-axis is the displacement of the target in millimeters. In the experiment, the frame rate of the detection was 30 frames/s. The correlation coefficients and standard deviations of the differences between the input signals and the measured values were also measured.
