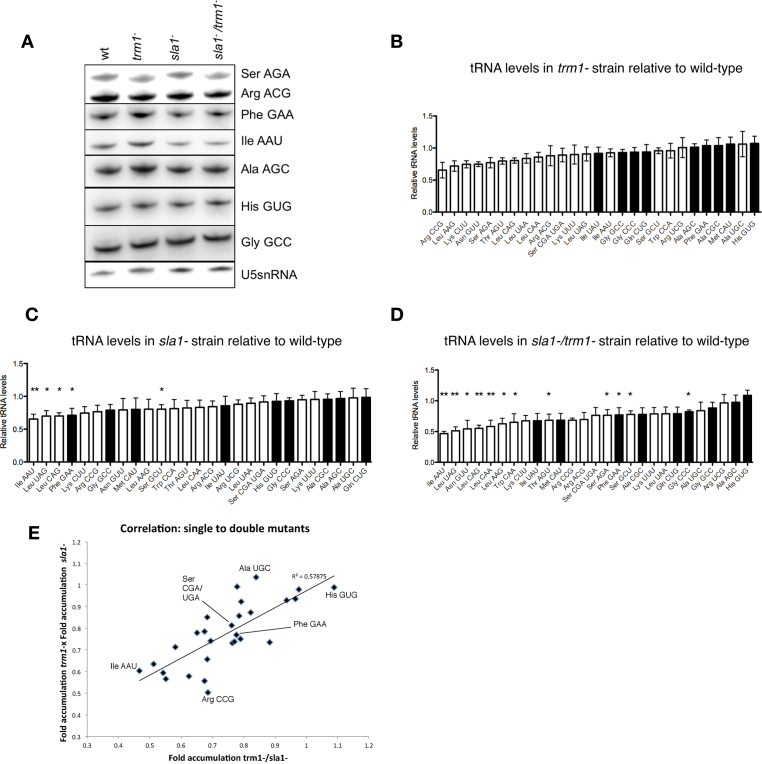
Figure 4.
Variability in relative tRNA abundance in sla1−/trm1− cells. (A) Northern blot of total RNA extracted from indicated strains probed for various tRNAs or the U5 snRNA. (B) Relative abundance of G26-containing and non-G26 containing tRNAs in trm1− cells, normalized to tRNA levels in the WT strain as well as the U5 snRNA as the endogenous loading control. Note that in Schizosaccharomyces pombe, the mature tRNA-SerCGA and tRNA-SerUGA species differ by a single nucleotide in the anticodon loop, and so our probe for northern blot is expected to react with both. White bars: G26-modified tRNAs; black bars: tRNAs lacking a ‘G’ at position 26 or lacking modification at G26 by Trm1p (41). Error bars: SEM. (C) Relative abundance of G26-containing and non-G26 containing tRNAs in sla1− cells. Significant drops in tRNA abundance relative to the WT strain are marked with * (P ≤ 0.05) or ** (P ≤ 0.01). (D) Relative abundance of G26-containing and non-G26 containing tRNAs in sla1−/trm1− cells. (E) Correlation between the product of the tRNA levels in the trm1− and sla1− strains versus the levels of the respective tRNAs in the sla1−/trm1− strain. All tRNAs are represented; some tRNAs are annotated as reference points.

