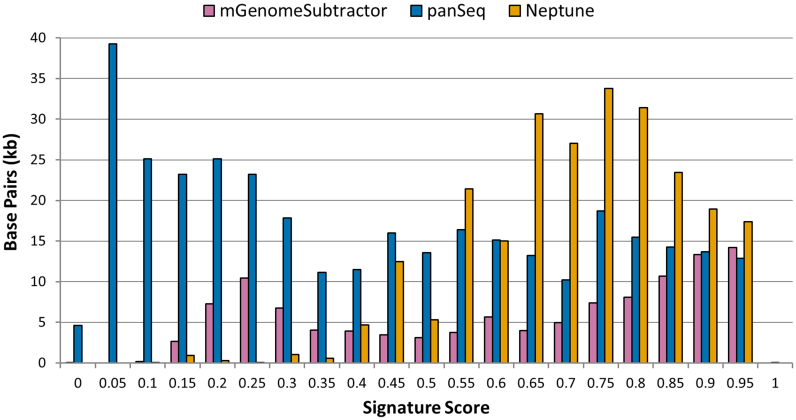
Figure 4.
A comparison of the the population-level discriminatory power, as determined by signature score (Equation 11), for sequences identified by mGenomeSubtractor (pink), panSeq (blue) and Neptune (orange) when operating on a dataset comprised of 20 Enterococcus hirae and 20 Enterococcus faecium genomes. The histogram depicts total signature sequence (y-axis; measured in base pairs) with a combined discrimination score falling within given scoring intervals (x-axis). Each score interval may contain more than one identified signature. Sequences with calculated scores closer to 1 are highly discriminatory, whereas those nearing 0 have no discriminatory power to distinguish between inclusion and exclusion genome groups.

