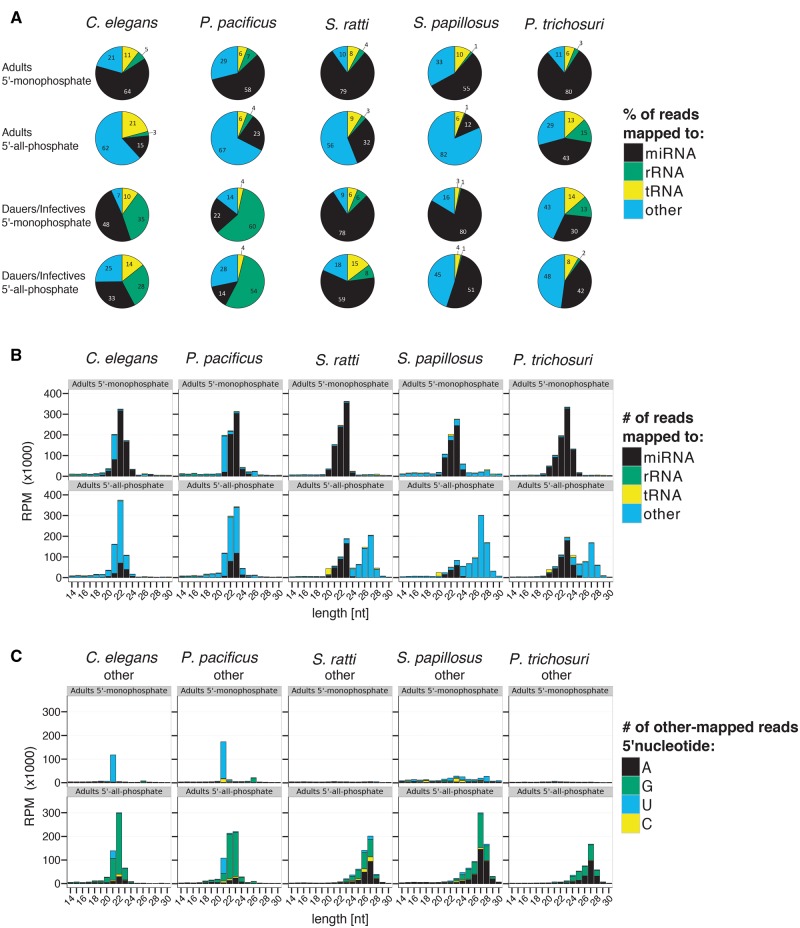
Fig. 2.
—sRNA profiles. (A) Piecharts representing the percentage of all mapped reads classified as miRNAs (black), rRNA-derived (green), tRNA-derived (yellow), or other (blue). (B) Barplots showing the length distribution of small RNA classes. The color code is the same as in (A). (C) Barplots of the length distribution and 5′ nucleotide of sRNAs classified as other. Reads starting with A, G, U, or C are represented in black, green, blue, and yellow, respectively. In all cases, the average of the three biological replicates is given. In B and C only the results for adults and in C only the results for the class “other” are given. For the corresponding plots for dauers/infectives and for the other sRNA classes see supplementary figure 2, Supplementary Material online. 5′-Monophosphate RNA not treated with TAP before library construction; 5′-all-phosphate RNA treated with TAP before library construction; RPM: reads per million; length[nt]: read length in nucleotides.

