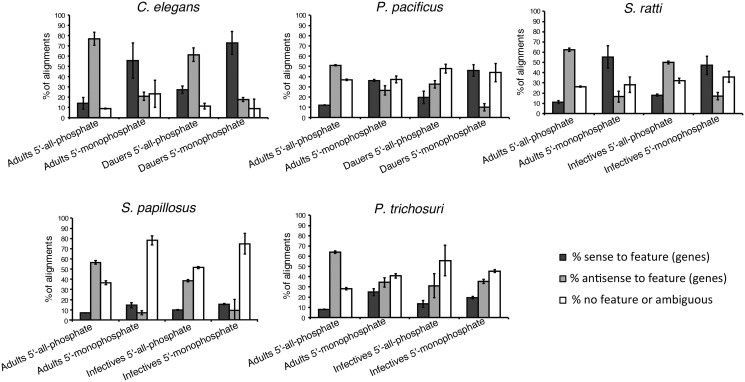
Fig. 3.
—TAP-treatment enriches for reads that align antisense to annotated genes in all five species studied. Barplots showing the percentage of other mapped reads that map to annotated features (genes) in either sense (dark gray) or antisense (light gray) orientation or reads that map ambiguously or to regions of the genome without annotated features (white). Notice that the proportion of reads that does not map to annotated parts of the genome is highly dependent on the quality of the genome annotations, which varies strongly between the five species under study. Therefore only the ratio of sense mapped reads to antisense mapped reads is relevant. Given are the means of the three biological replicates. The errorbars indicate the standard deviations.

