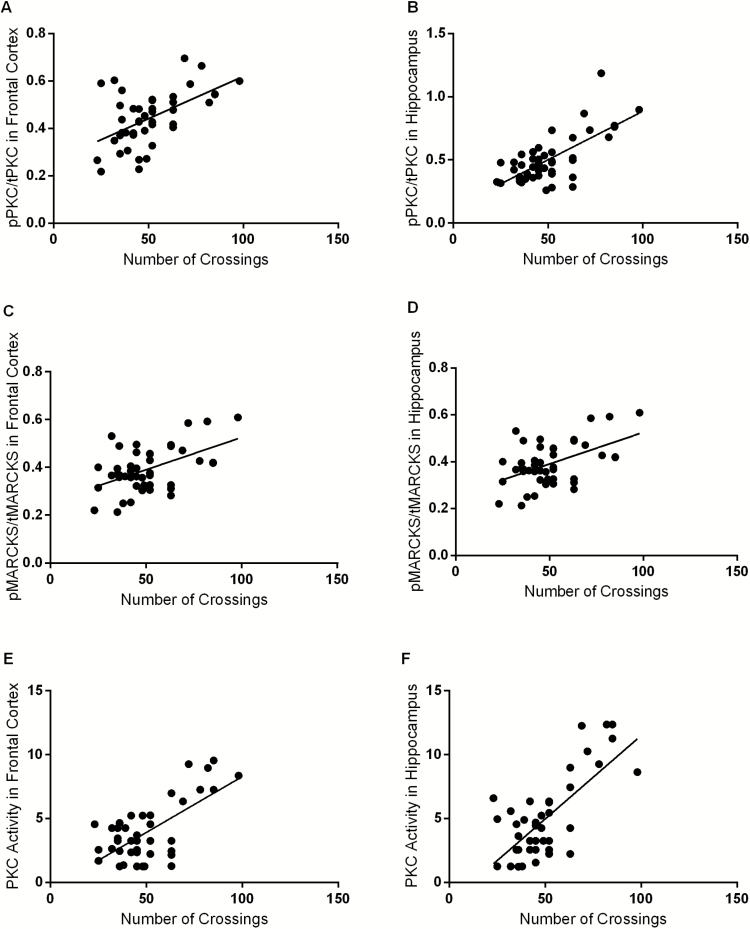
Figure 5.
Correlations between locomotor activity (number of crossings) and protein kinase C (PKC) phosphorylation in frontal cortex (A). Correlations between locomotor activity (number of crossings) and PKC phosphorylation in hippocampus (B). Myristoylated alanine-rich C kinase substrate (MARCKS) phosphorylation in frontal cortex (C). Correlations between locomotor activity (number of crossings) and MARCKS phosphorylation in hippocampus (D); and PKC activity in frontal cortex (E). Correlations between locomotor activity (number of crossings) and PKC activity in hippocampus (F) of animals submitted to ouabain-induced animal model. Results were assessed using the Pearson correlation test. PKC phosphorylation x crossings [frontal cortex (n=44; r2=0.29; P<.001), hippocampus (n = 44; r2 = 0.48; P<.001)]. MARCKS phosphorylation x crossings [frontal cortex (n = 44; r2 = 0.25; P<.001), hippocampus (n = 44; r2 = 0.25; P<.001)]. PKC activity x crossings [frontal cortex (n = 44; r2 = 0.44; P<.001), hippocampus (n = 44; r2 = 0.5; P<.001)].

