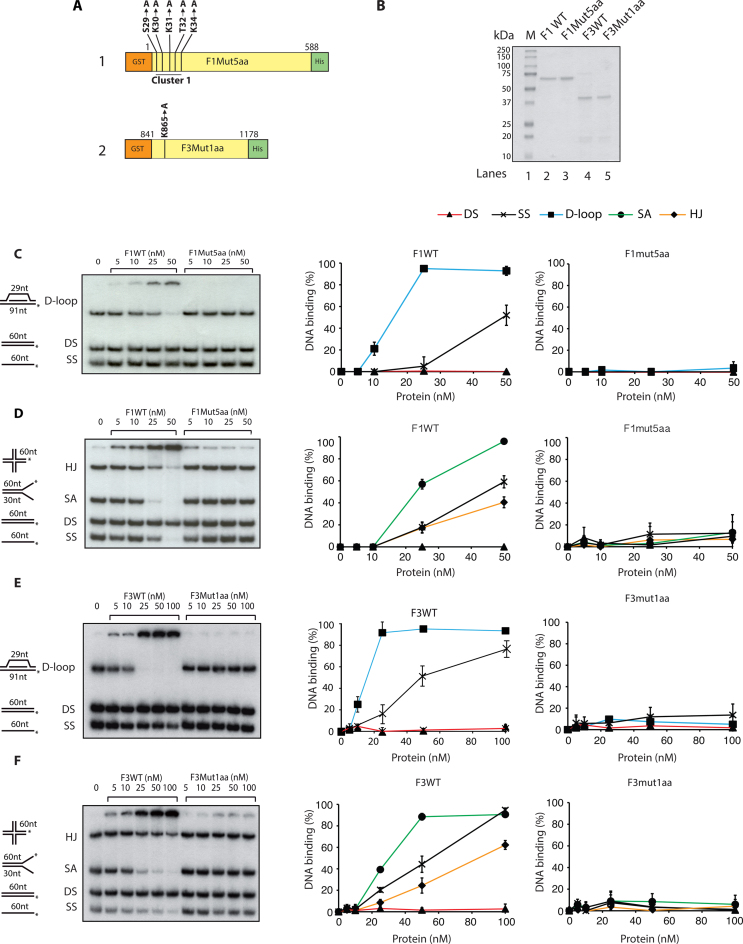
Figure 4.
Loss of DNA binding upon mutations of amino acid residues in FANCD2 F1 and F3 fragments. (A) Diagram representation of F1 (1) and F3 (2) domains indicating point mutations generated by site-specific mutagenesis. Cluster1 in F1 indicates the substitution of five amino acids (aa) (S29A, K30A, K31A, T32A, K34A) and here by would be referred as F1Mut5aa. (B) Coomassie blue staining of purified F1WT (66 kDa), F1Mut5aa (66 kDa), F3WT (38 kDa), F3Mut1aa (38 kDa) proteins. M, molecular mass marker. DNA binding assays of F1WT and F1Mut5aa in competition-I (C) and competition-II (D). DNA binding quantifications are shown at the right. DNA binding activity of F3WT and F3Mut1aa in competition-I (E) and competition-II (F). DNA binding quantifications are shown at the right. In both the competitions 20 nm of each DNA substrate was used. Error bars indicate S.E from three independent experiments.

