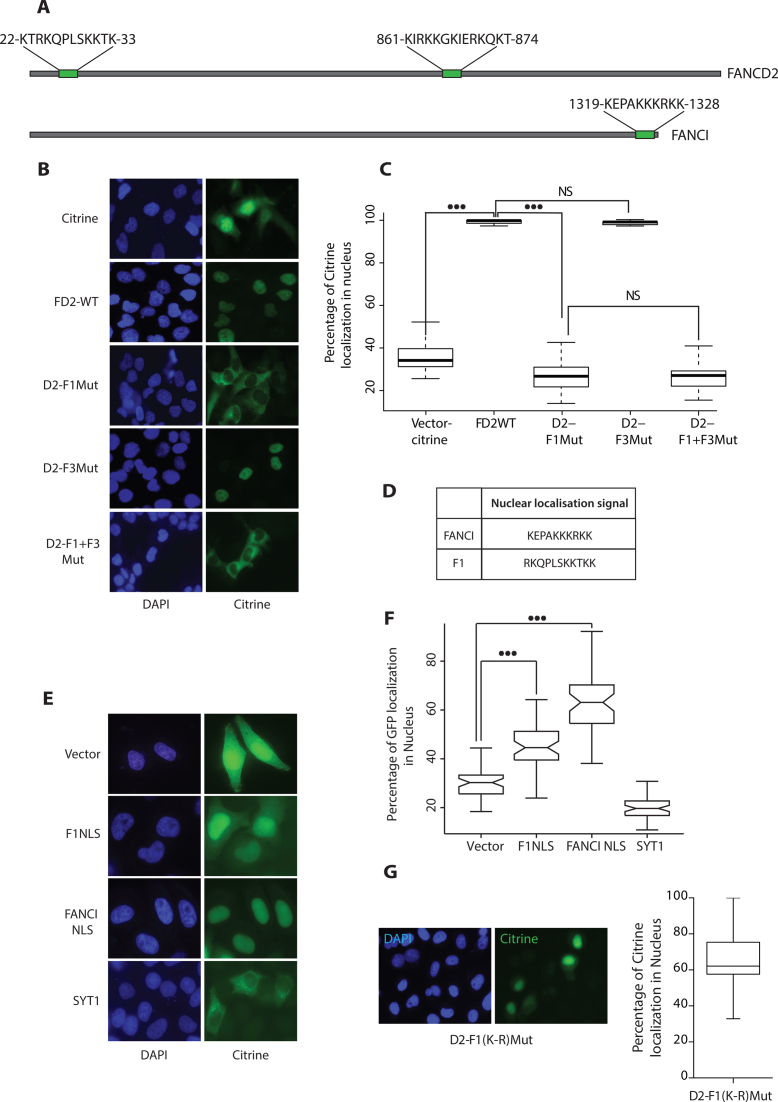
Figure 6.
DNA binding residues in region F1 acts as a Nuclear Localization Signal for FANCD2. (A) Represents the hit map of the putative NLS sequences using the NLS prediction tool (www.moseslab.csb.utoronto.ca/NLStradamus) over full length FANCD2 and FANCI. (B) FANCD2-deficient cells (FA-D2) were transfected with the indicated citrine tagged FANCD2 expression constructs. Twenty-four hours post transfection, cells were fixed and stained with 4,6-diaminidino-2-phenyllindole (DAPI) to mark the nucleus. (C) A total of 60 cells transfected with the citrine vector, FANCD2 WT, F1Mut, F3Mut, F1+F3Mut and were scored and box plotted for percentage of citrine expressed in the nucleus. (D) NLS sequences used for F1 and FANCI. (E) NLS sequences predicted in (A) were fused to eGFP and transfected in HeLa cells. peGFP-C1 and SYT1 were used as vector and a cytoplasmic control. Twenty-four hours post transfection, cells were fixed and stained with 4,6-diaminidino-2-phenyllindole (DAPI) to mark the nucleus. Representative images of each expression constructs are shown. (F) A total of 60 cells were counted for F1NLS, FANCI NLS, pEGFP-C1, and SYT1 were scored and box plotted for percentage of eGFP expressed in the nucleus. Wilcoxon's test was employed, P-value<0.01 represents significant difference indicated by (***). (G) FA-D2 cells were transfected with the D2-F1(K-R)Mut as described in B and a total of 60 cells were scored and box plotted for percentage of citrine expressed in the nucleus.

