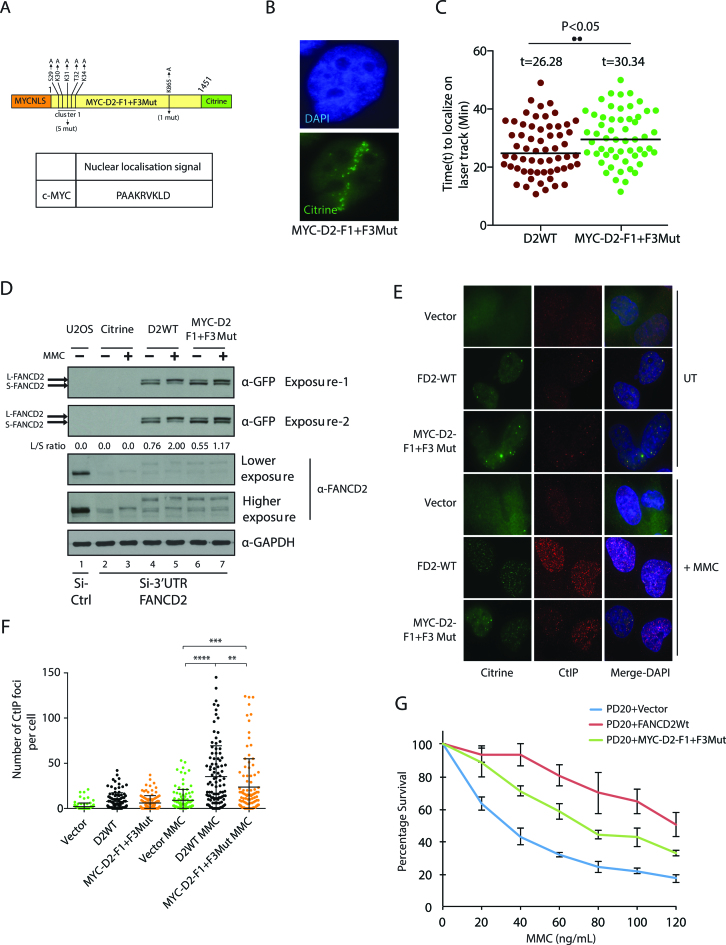
Figure 8.
FANCD2 DNA binding mutant MYC-D2-F1+F3Mut exhibit impaired function in the FA pathway although it is relocalized to the nucleus by an heterologous NLS. (A) Diagram of MYC-D2-F1+F3Mut construct. The c-MYC NLS sequence was tagged to the N-terminal FANCD2-F1+F3-Mut-citrine construct to produce MYC-D2 F1+F3Mut. (B) MYC-D2-F1+F3Mut localizes to laser-induced DSBs. (C) Kinetics of recruitment of MYC-D2-F1+F3Mut compared to wild-type FANCD2. (D) U2OS cells stably expressing vector, MYC-D2-F1+F3Mut (also fused to citrine), and D2WT-citrine were transfected with control or 3′-UTR FANCD2 siRNA. Eight hours post second transfection; cells were untreated or treated with 150 ng/ml of MMC for 24 h. Whole cell extracts were immunoblotted with anti-GFP, anti-FANCD2 and anti-GAPDH antibodies. FANCD2 monoubiquitination was assessed from whole cell extracts by western blot with anti-GFP antibody. The L/S ratio between the monoubiquitinated form (L) and unmodified from of FANCD2 (S) is shown. (E) PD20 cells transfected with empty vector, MYC-D2-F1+F3Mut-citrine and D2-WT-citrine were used to score CtIP foci formation post-treatment with 80 ng/mL of MMC for 24 hours. Immunofluorescence against CtIP was performed and representative images are shown. (F) The number of CtIP foci shown in (E) was scored. The number of CtIP foci from three independent experiments were quantified and plotted as shown. Mann-–Whitney was employed, (**) represents significant difference with a P-value = 0.0021, (***) represents significant difference with a P-value = 0.0003 and (****) represents significant difference with a P-value <0.0001. (G) PD20 cells stably expressing mentioned constructs above were treated with the indicated concentration of MMC for 24 h. Seventy two hours post-incubation, cell survival was estimated with CellTiter-Glo Luminescent Cell Viability Assay. Error bar represents the S.E. from three independent experiments.

