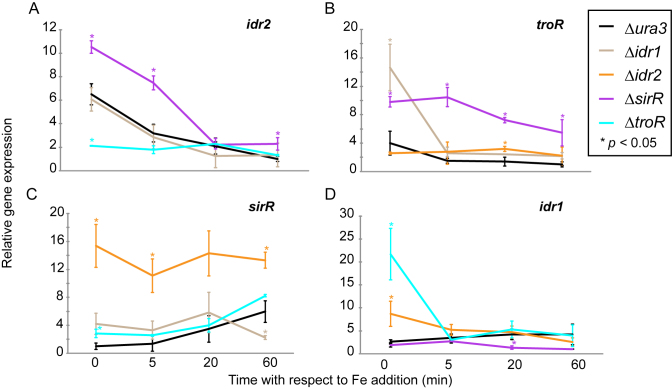
Figure 2.
Gene expression analysis by qRT- PCR demonstrates that TF-DNA binding has significant effects on gene expression of TF-coding genes. Expression of the genes (A) idr2 (B) troR (C) sirR and (D) idr1 across the iron re-addition time course. Each line indicates the expression of that gene in each of the knockout backgrounds of the other TFs (see legend for color scheme). Gene expression is relative to the highly expressed housekeeping control gene, VNG1756G. In each graph, the expression of the gene shown is normalized to the minimum value of expression across the genetic backgrounds. Each point on the graph represents the mean of three technical replicates from three independent biological replicates. Error bars represent SEM of biological replicates. Stars represent P < 0.05 from t-tests comparing expression of each gene in each knockout background at each time point to that in the Δura3 parent strain (Supplementary Table S3 for all P-values).

