Figure 5.
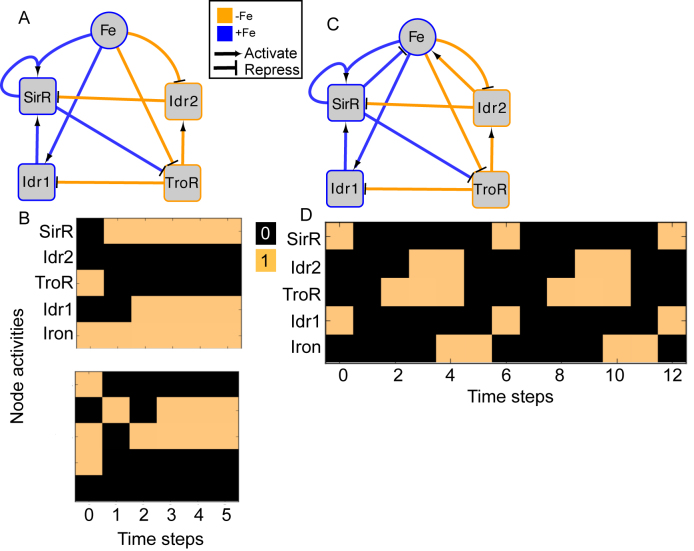
Boolean modeling predicts dynamical properties of the DtxR TF network. (A) Interlocking positive feedback network topology in the absence of regulatory feedback on iron uptake. Blue node outlines and edge colors represent regulatory relationships that are active in the presence of iron, whereas orange depicts activity in the absence of iron. (B) Each graph depicts one of the two attractors (iron sufficiency, top; iron starvation, bottom) for the network at two randomly selected starting states given the network shown in (A) and initial logic functions listed in Table 1. Colored blocks depict Boolean network node activities across the synchronously updating time steps (x-axis), where orange represents 1 (ON) and black represents 0 (OFF). Model simulations for all 32 possible starting states and alternative logic functions are given in Supplementary Figure S3. (C) Network topology including regulatory feedback on iron uptake. Logic functions are as in Table 1, with logic for iron shown at the bottom of the table. Node and edge colors are as in (A). (D) Oscillatory attractor state predicted by Boolean simulation of network topology shown in (C).

