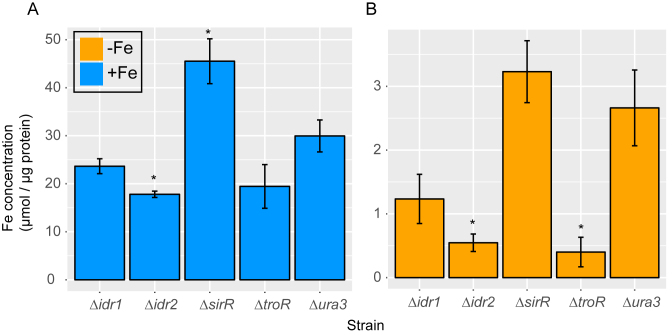
Figure 6.
Measurement of cytosolic iron accumulation in DtxR TF mutants by ICP-MS validates the GRN model. Bars represent measurements of ICP-MS iron quantification in the presence (A) and absence (B) of iron. Each bar represents the average and SD of three technical replicates from three independent biological replicates for each strain normalized to protein concentration. P-values of significance of differences between each mutant and the Δura3 parent strain by t-test are shown in Supplementary Table S3.

