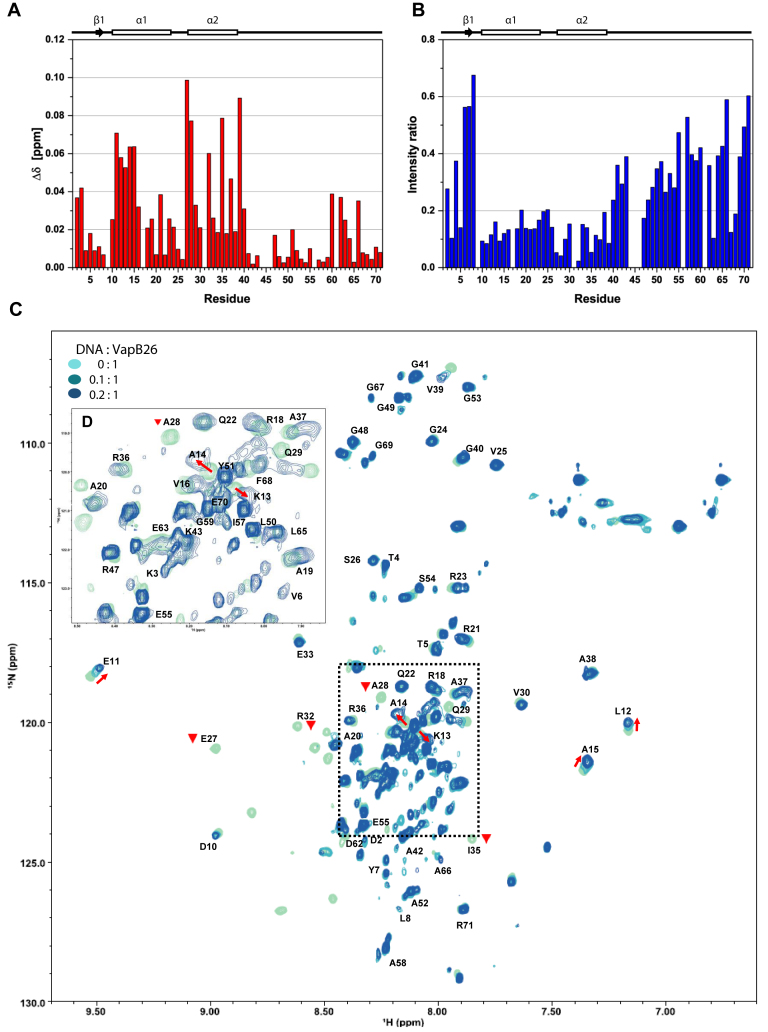
Figure 10.
NMR titration of VapB26 and its promoter DNA. (A and B) Secondary structure elements based on the TALOS+ analysis are presented above the plots. (A) The chemical shift perturbation of each residue in the presence of 0.08 mM promoter DNA. The residues in the N-terminal RHH DNA-binding domain (Glu11, Leu12, Lys13, Ala14, Ala15, Glu27, Ala28, Arg32, Ile35 and Val39 in the α1 and α2 helices) show CSP values >0.05 (blue dotted line). (B) Relative peak intensity compared to that of the DNA-free form. The peak intensities for Glu27, Ala28, Arg32 and Ile35 in the α2 helix exhibited the largest decreases of <5% compared to the peak intensity of the free form. (C) Overlay of 2D 1H-15N HSQC spectra of 0.4 mM VapB26 with increasing ratios of added DNA. VapB26 with no DNA is shown in light blue, VapB26 with 0.04 mM DNA is shown in medium blue and VapB26 with 0.08 mM DNA is shown in dark blue. The red arrows show the peak shift direction. The Glu27, Ala28, Arg32 and Ile35 peaks disappeared during the interaction with DNA (inverted red triangle). The unassigned residues are not shown. (D) Expanded views of the peak overlap region highlighted with a black dotted square in (C). The spectrum shows DNA/protein ratios of 0 and 0.2.

